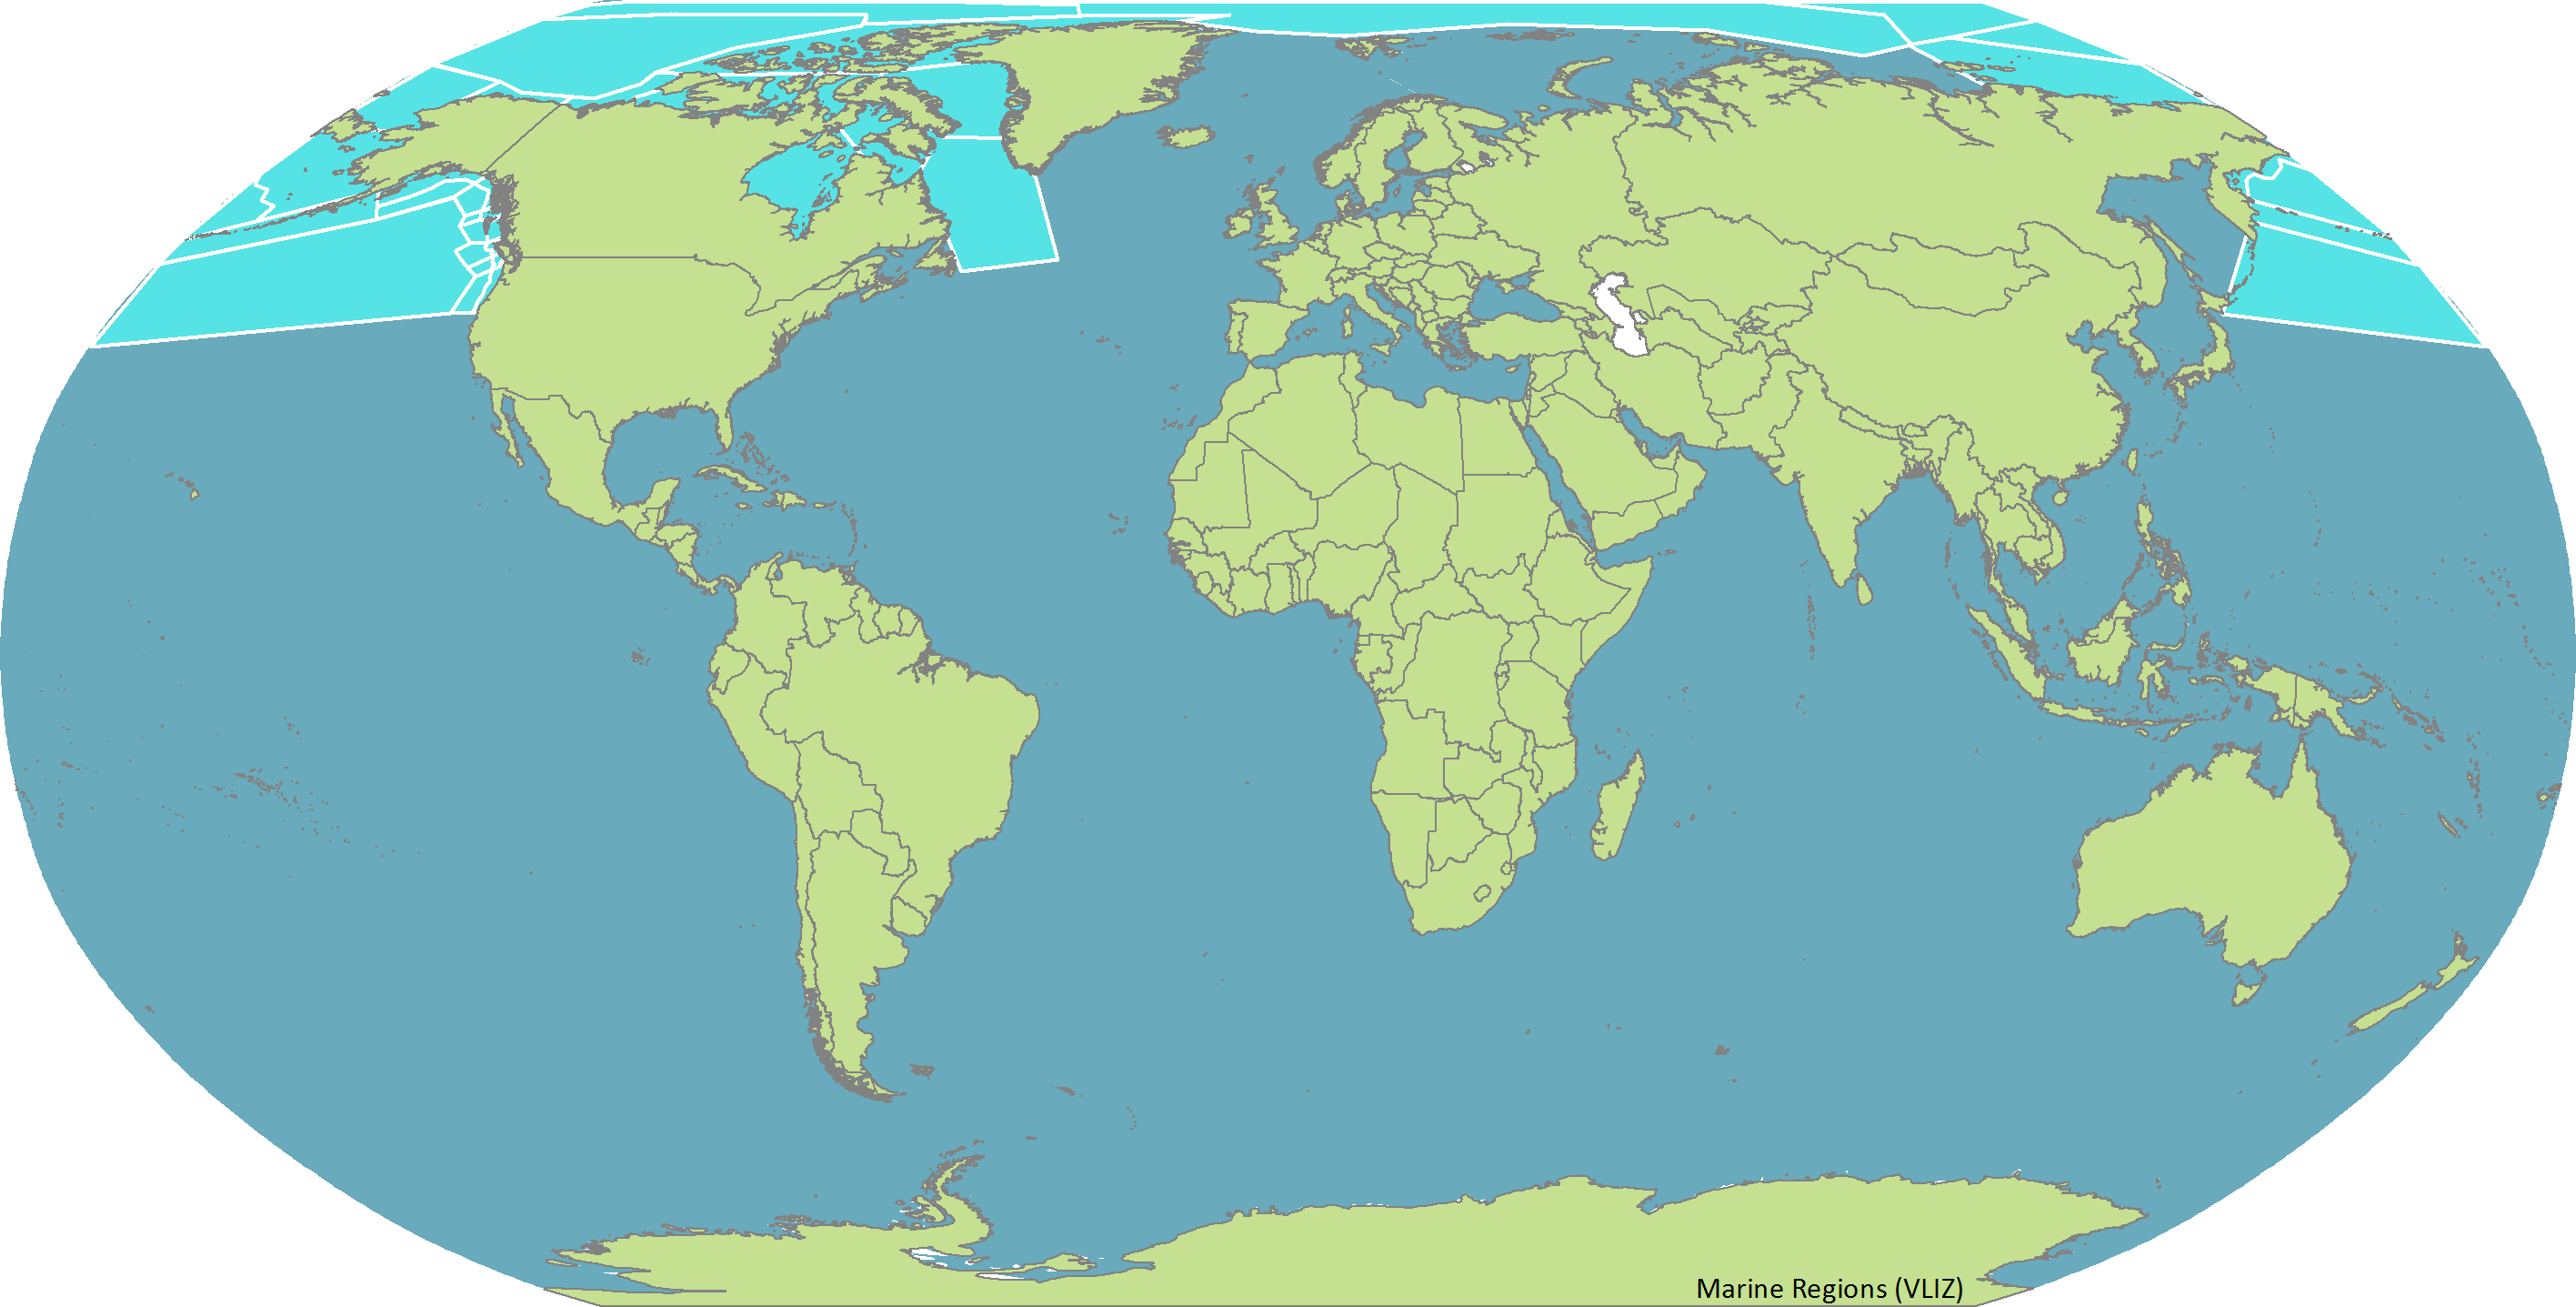
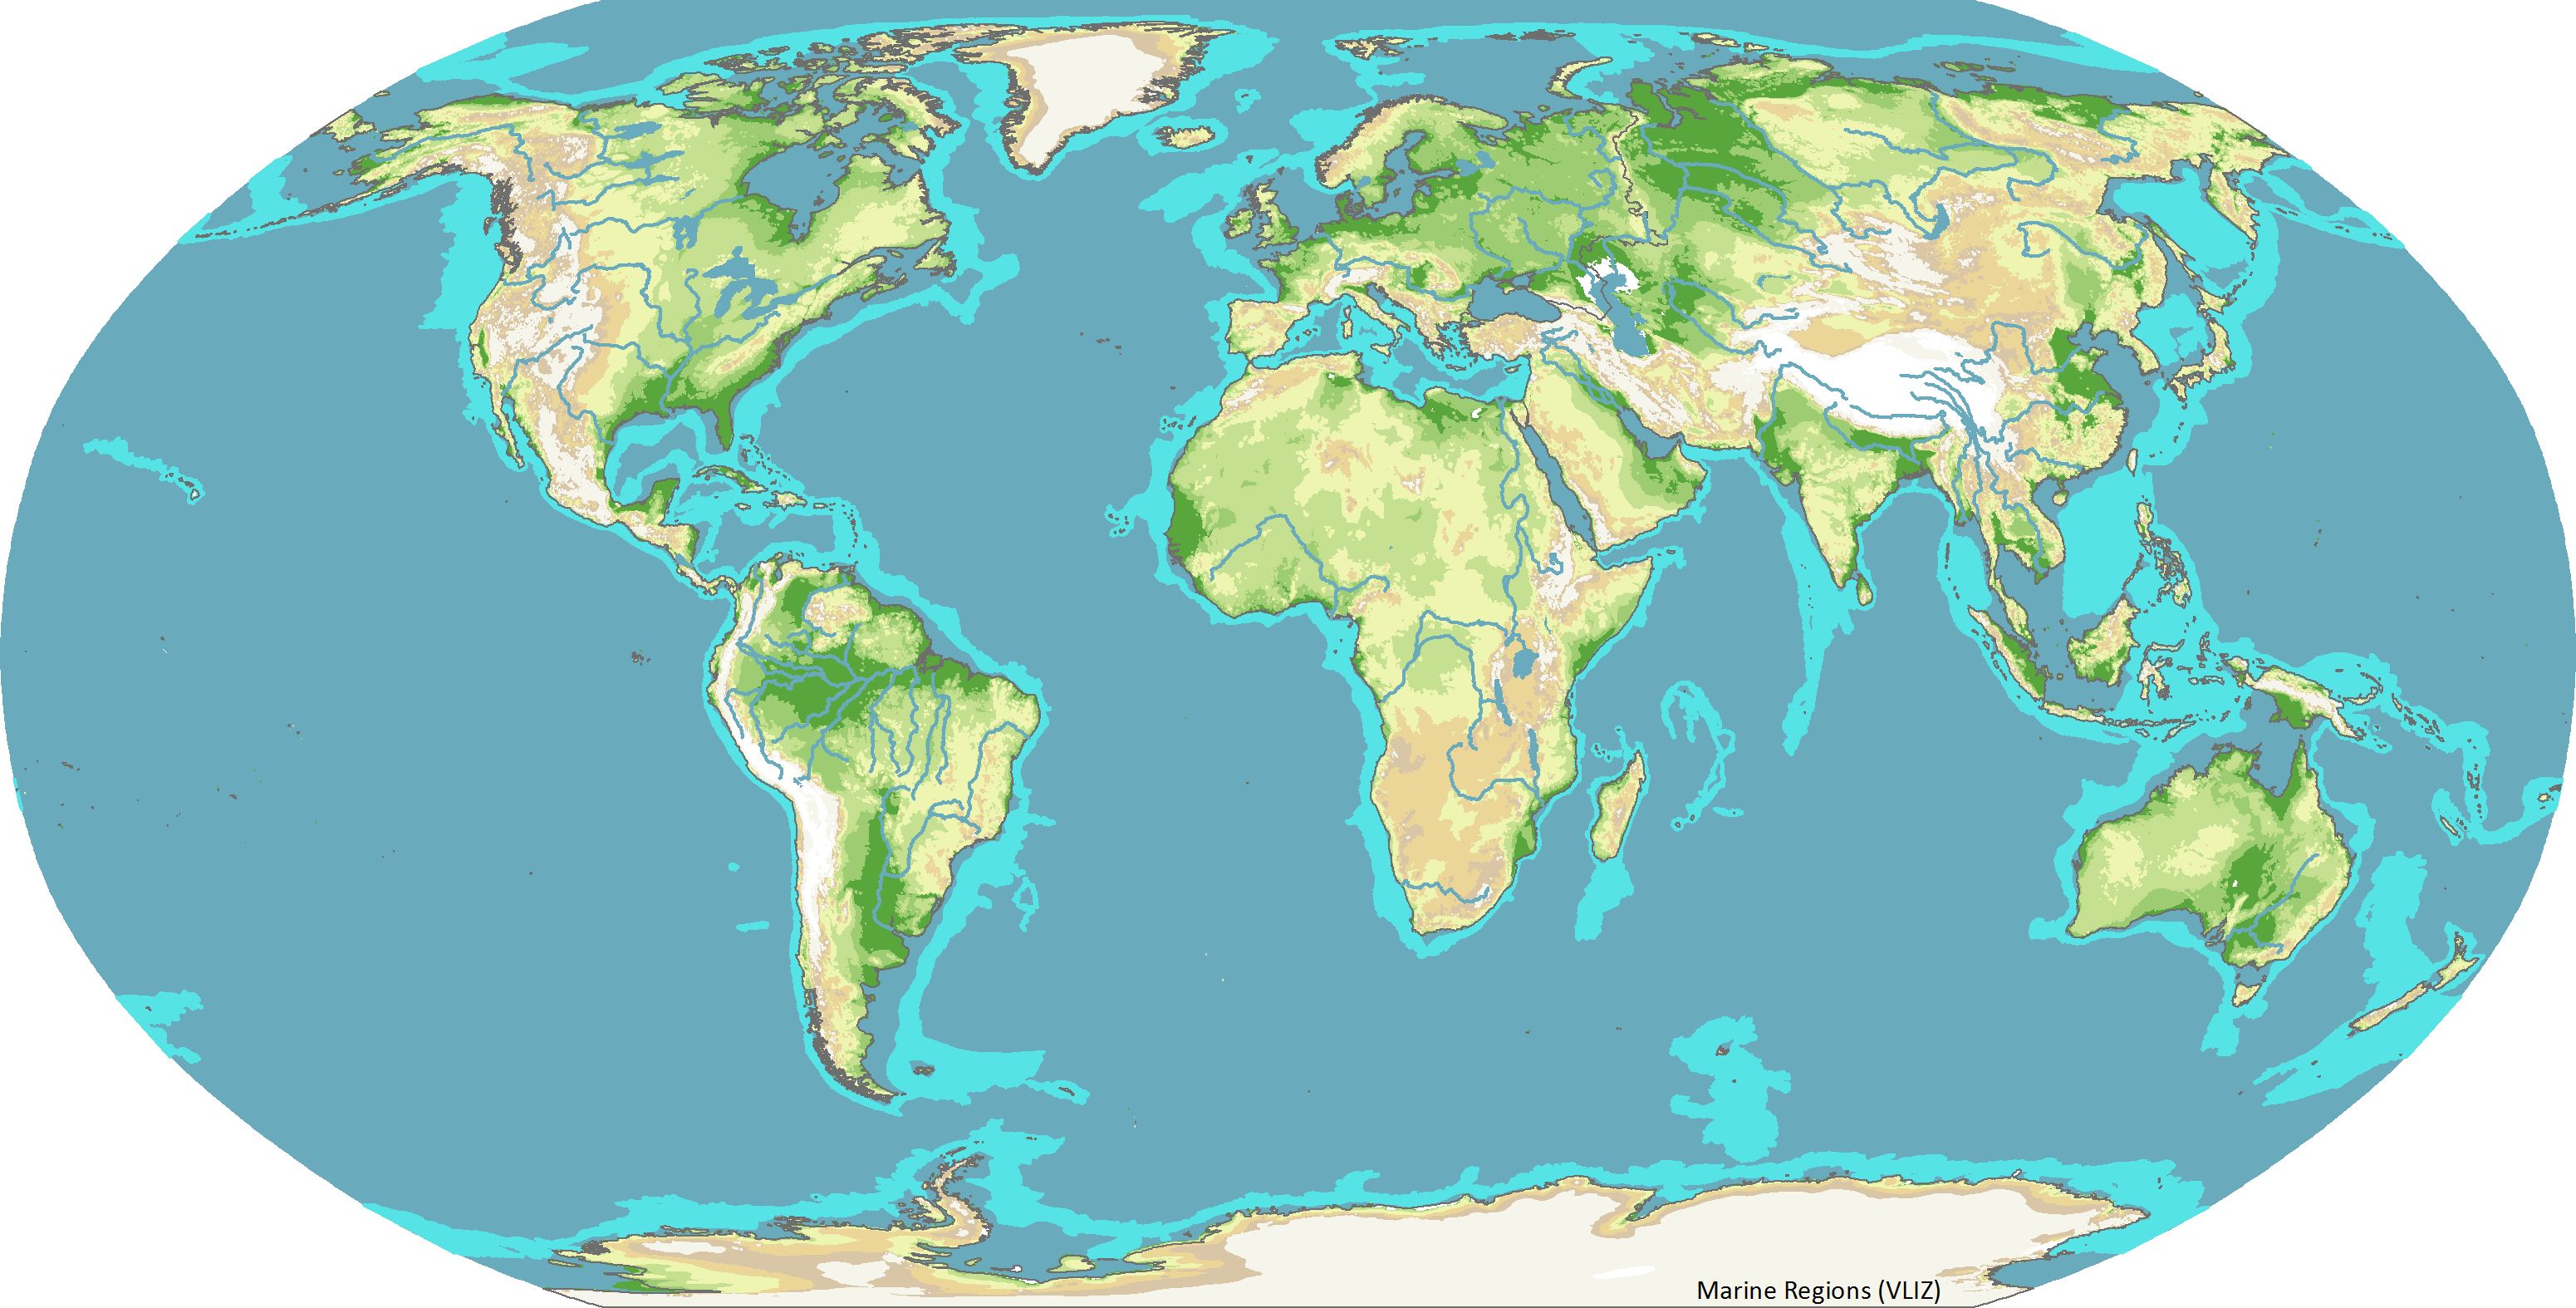
Marine boundaries

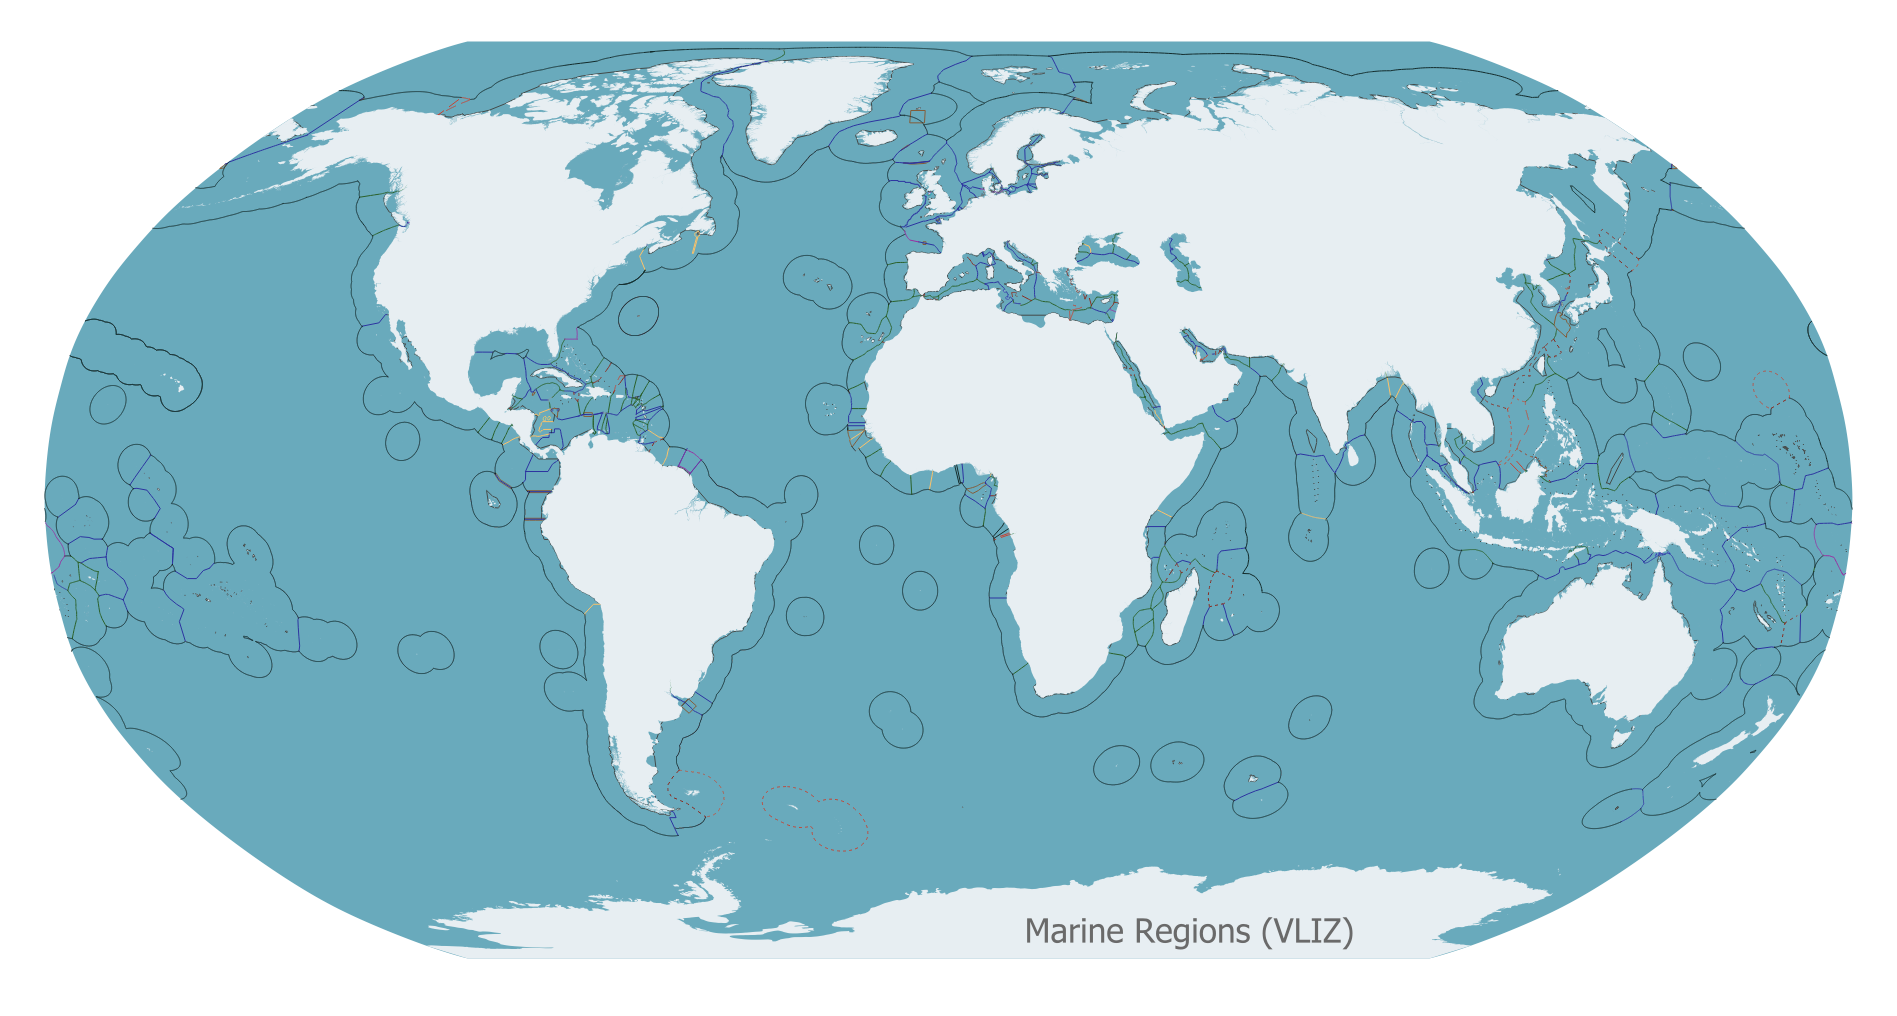
 Maritime Boundaries (200, 12, 24 nautical miles, internal waters, archipelagic waters, high seas and extended continental shelves)
This geodatabase represents the Maritime Boundaries of the world. The database includes seven global datasets, the latest versions of which are:
-
Maritime Boundaries, version 12
- Exclusive Economic Zones (200NM), version 12 (including the boundary polylines) https://doi.org/10.14284/632
- Territorial Seas (12NM), version 4 https://doi.org/10.14284/633
- Contiguous Zones (24NM), version 4 https://doi.org/10.14284/630
- Internal Waters, version 4 https://doi.org/10.14284/631
- Archipelagic Waters, version 4 https://doi.org/10.14284/629
- High Seas, version 2 https://doi.org/10.14284/696
- Extended Continental Shelves, version 2 (including the boundary polylines) https://doi.org/10.14284/697
Preferred citation:
Flanders Marine Institute (2023). Maritime Boundaries Geodatabase, version 12. Available online at https://www.marineregions.org/. https://doi.org/10.14284/628
Please note that for the delineation of our EEZ, we include the archipelagic waters and the internal waters of each country. This is a deviation from the UNCLOS EEZ definition.
Download Maritime Boundaries | Methodology
Remarks and corrections can be sent to info@marineregions.org.
1) Maritime Boundaries Geodatabase: Exclusive Economic Zones (200NM), version 12
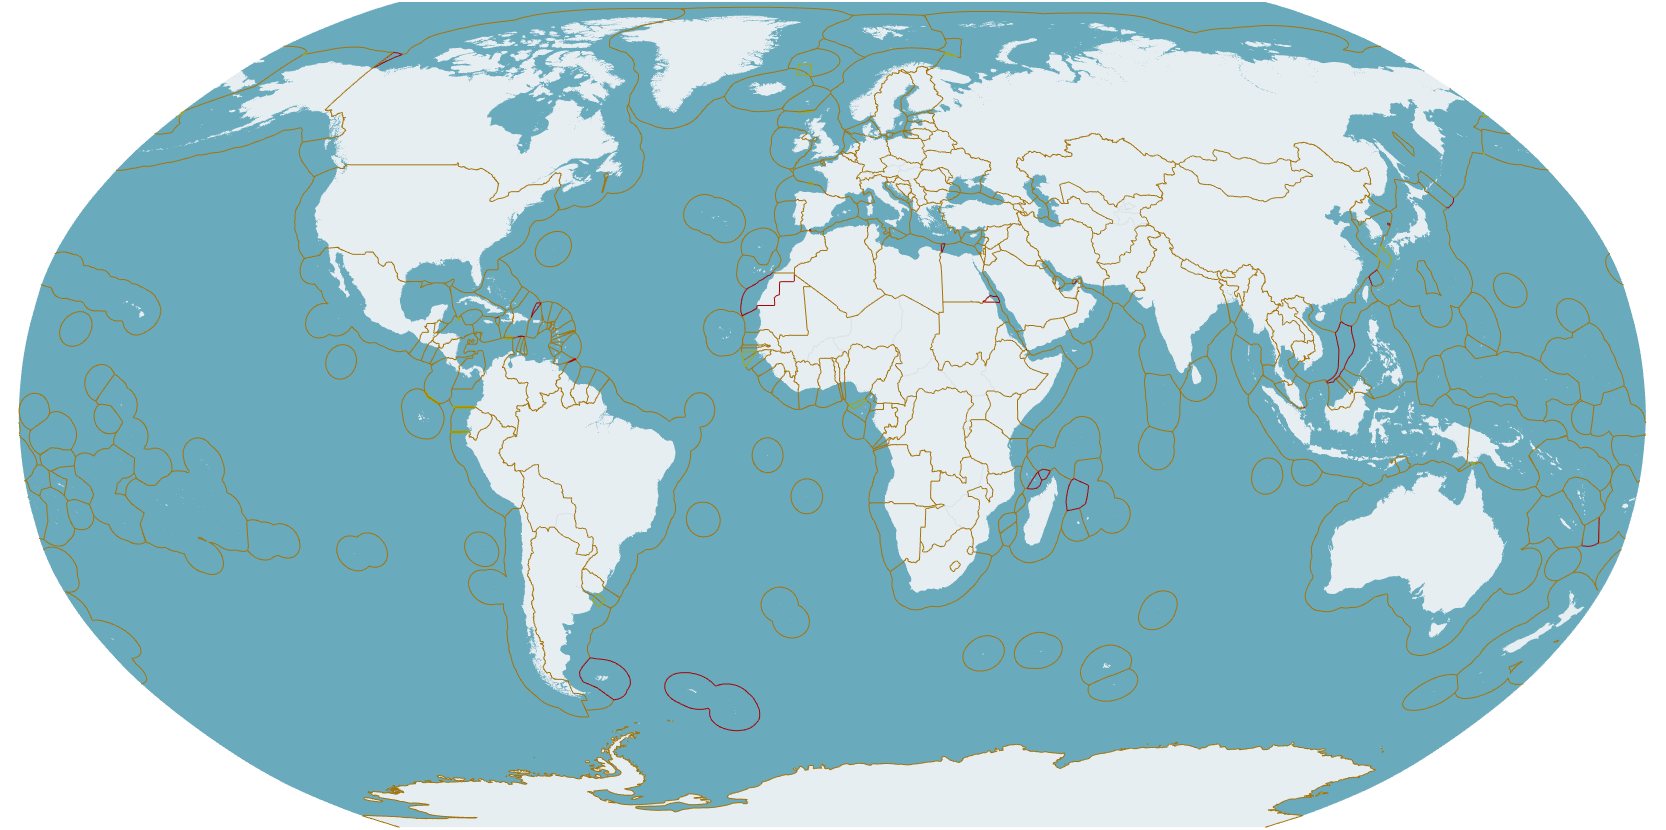
This dataset builds on previous versions of the world's EEZ. In version 9, the 200 nautical miles outer limit was completely recalculated using a higher resolution coastline as a normal baseline (ESRI Countries 2014) and straight baselines, where available. This dataset consists of two shapefiles: polylines that represent the maritime boundaries of the world's countries, the other one is a polygon layer representing the Exclusive Economic Zone of countries. This dataset also contains digital information about treaties, joint regime, and disputed boundaries.
Preferred citation:
Flanders Marine Institute (2023). Maritime Boundaries Geodatabase: Maritime Boundaries and Exclusive Economic Zones (200NM), version 12. Available online at https://www.marineregions.org/. https://doi.org/10.14284/632
2) 12 nautical miles zones (territorial seas)
Area enclosed within the maritime delimitations of a coastal state extending 12 Nautical Miles seawards from the baselines (normal and straight where available).
Preferred citation:
Flanders Marine Institute (2023). Maritime Boundaries Geodatabase: Territorial Seas (12NM), version 4. Available online at https://www.marineregions.org/. https://doi.org/10.14284/633
3) 24 nautical miles zones (contiguous zones)
Area enclosed within the maritime delimitations of a coastal state extending 24 Nautical Miles seawards from the baselines (normal and straight where available) and excluding the 12 nautical miles zone.
Preferred citation:
Flanders Marine Institute (2023). Maritime Boundaries Geodatabase: Contiguous Zones (24NM), version 4. Available online at https://www.marineregions.org/. https://doi.org/10.14284/630
4) Internal Waters
The area of the seas enclosed between the landward side of the Straight baselines and the seaward side of the normal baselines (coastline).
Preferred citation:
Flanders Marine Institute (2023). Maritime Boundaries Geodatabase: Internal Waters, version 4. Available online at https://www.marineregions.org/. https://doi.org/10.14284/631
5) Archipelagic Waters
The area of the seas enclosed between the landward side of the Archipelagic baselines and the seaward side of the normal baselines (coastline).
Preferred citation:
Flanders Marine Institute (2023). Maritime Boundaries Geodatabase: Archipelagic Waters, version 4. Available online at https://www.marineregions.org/. https://doi.org/10.14284/629
6) Extended Continental Shelves
The portion of the continental shelf that extends beyond 200 Nautical Miles, as submitted by a State to or recommended by the Commission on the Limits of the Continental Shelf (CLCS), or deposited with the Division for Ocean Affairs and the Law of the Sea (DOALOS), or claimed by (a) a Non-Party State to UNCLOS or (b) a Party State to UNCLOS through mechanisms other than a submission to the CLCS or a deposit to DOALOS. This dataset consists of two files: polylines that represent the outer limits of the Extended Continental Shelves, the other one is a polygon layer representing the Extended Continental Shelves. This dataset also contains digital information about the underlying sources, and overlapping claims.
Preferred citation:
Flanders Marine Institute (2024). Maritime Boundaries Geodatabase: Extended Continental Shelves, version 2. Available online at https://www.marineregions.org/. https://doi.org/10.14284/697
7) High Seas
The area of the seas that is not included in the exclusive economic zone, in the territorial sea or in the internal waters of a State, or in the archipelagic waters of an archipelagic State.
Preferred citation:
Flanders Marine Institute (2024). Maritime Boundaries Geodatabase: High Seas, version 2. Available online at https://www.marineregions.org/. https://doi.org/10.14284/696
Archived files
Maritime Boundaries Geodatabase, version 11:
Preferred citation:
Flanders Marine Institute (2019). Maritime Boundaries Geodatabase, version 11. Available online at https://www.marineregions.org/. https://doi.org/10.14284/382
- Exclusive Economic Zones (200NM), version 11, https://doi.org/10.14284/386
- Territorial Seas (12NM), version 3, https://doi.org/10.14284/387
- Contiguous Zones (24NM), version 3, https://doi.org/10.14284/384
- Internal Waters, version 3, https://doi.org/10.14284/385
- Archipelagic Waters, version 3, https://doi.org/10.14284/383
- Extended Continental Shelves, version 1, https://doi.org/10.14284/577
- High Seas, version 1, https://doi.org/10.14284/418
Maritime Boundaries Geodatabase, version 10:
Preferred citation:
Flanders Marine Institute (2018). Maritime Boundaries Geodatabase, version 10. Available online at https://www.marineregions.org/. https://doi.org/10.14284/319
- Exclusive Economic Zones (200NM), version 10, https://doi.org/10.14284/312
- Territorial Seas (12NM), version 2, https://doi.org/10.14284/313
- Contiguous Zones (24NM), version 2, https://doi.org/10.14284/314
- Internal Waters, version 2, https://doi.org/10.14284/315
- Archipelagic Waters, version 2, https://doi.org/10.14284/316
Maritime Boundaries Geodatabase, version 9:
Preferred citation:
Flanders Marine Institute (2016). Maritime Boundaries Geodatabase, version 9. Available online at https://www.marineregions.org/. https://doi.org/10.14284/317
- Exclusive Economic Zones (200NM), version 9, https://doi.org/10.14284/242
- Territorial Seas (12NM), version 1, https://doi.org/10.14284/243
- Contiguous Zones (24NM), version 1, https://doi.org/10.14284/244
- Internal Waters, version 1, https://doi.org/10.14284/245
- Archipelagic Waters, version 1, https://doi.org/10.14284/246
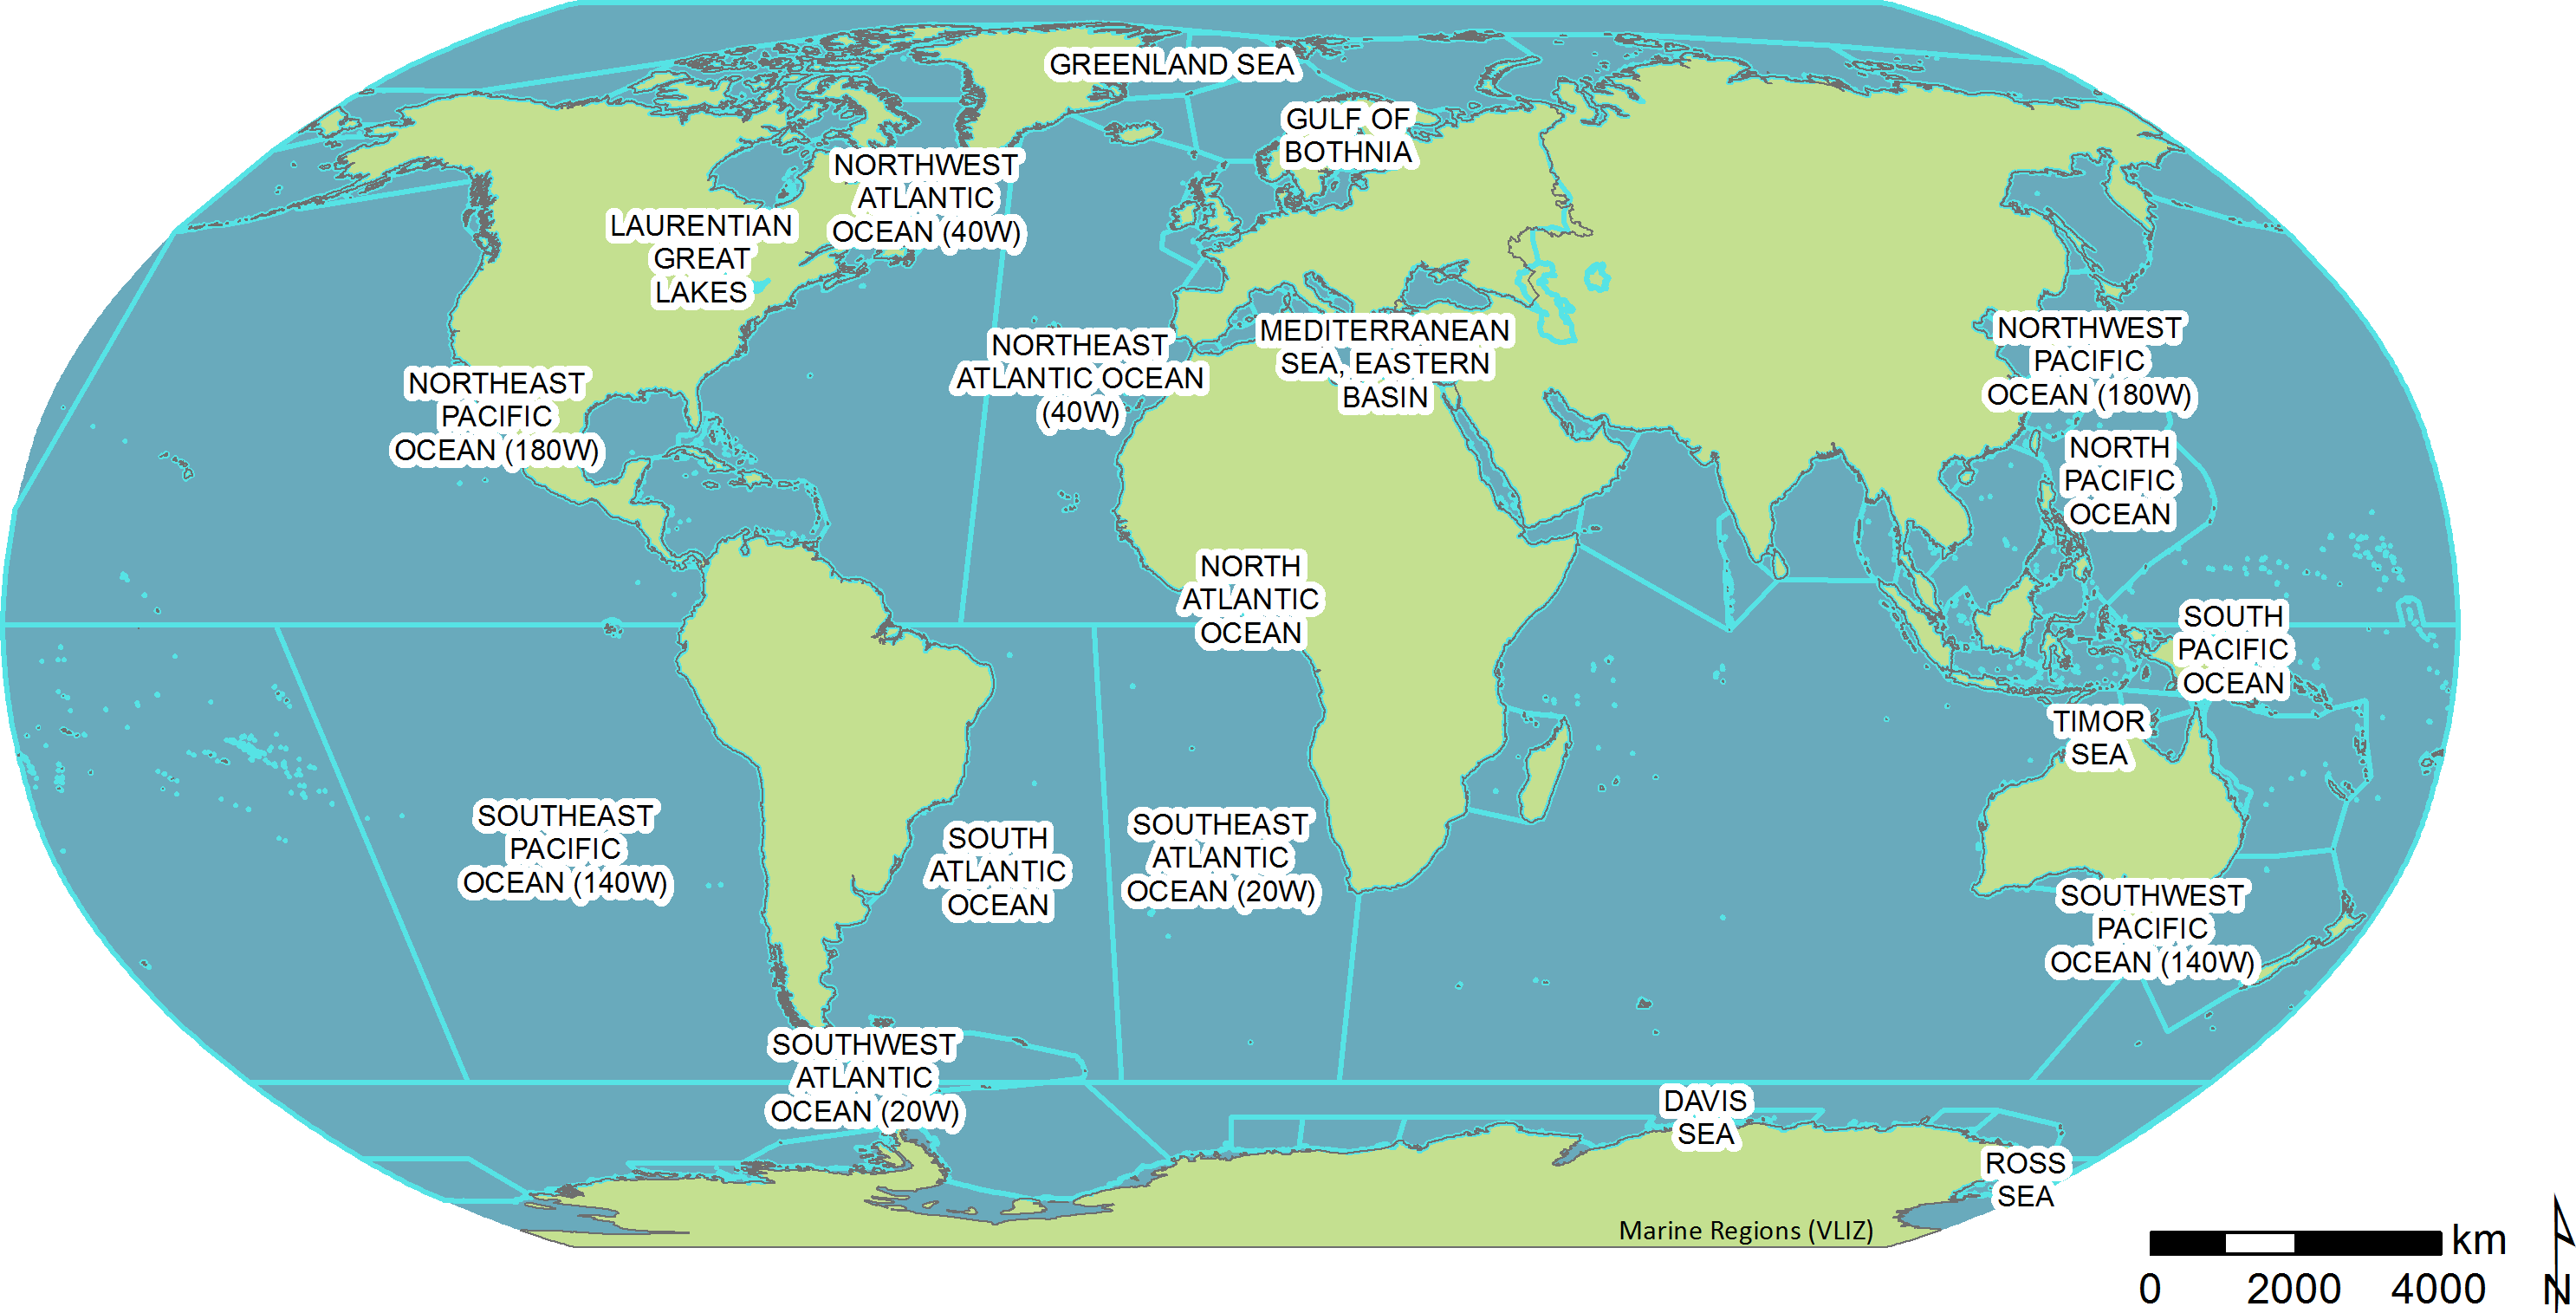
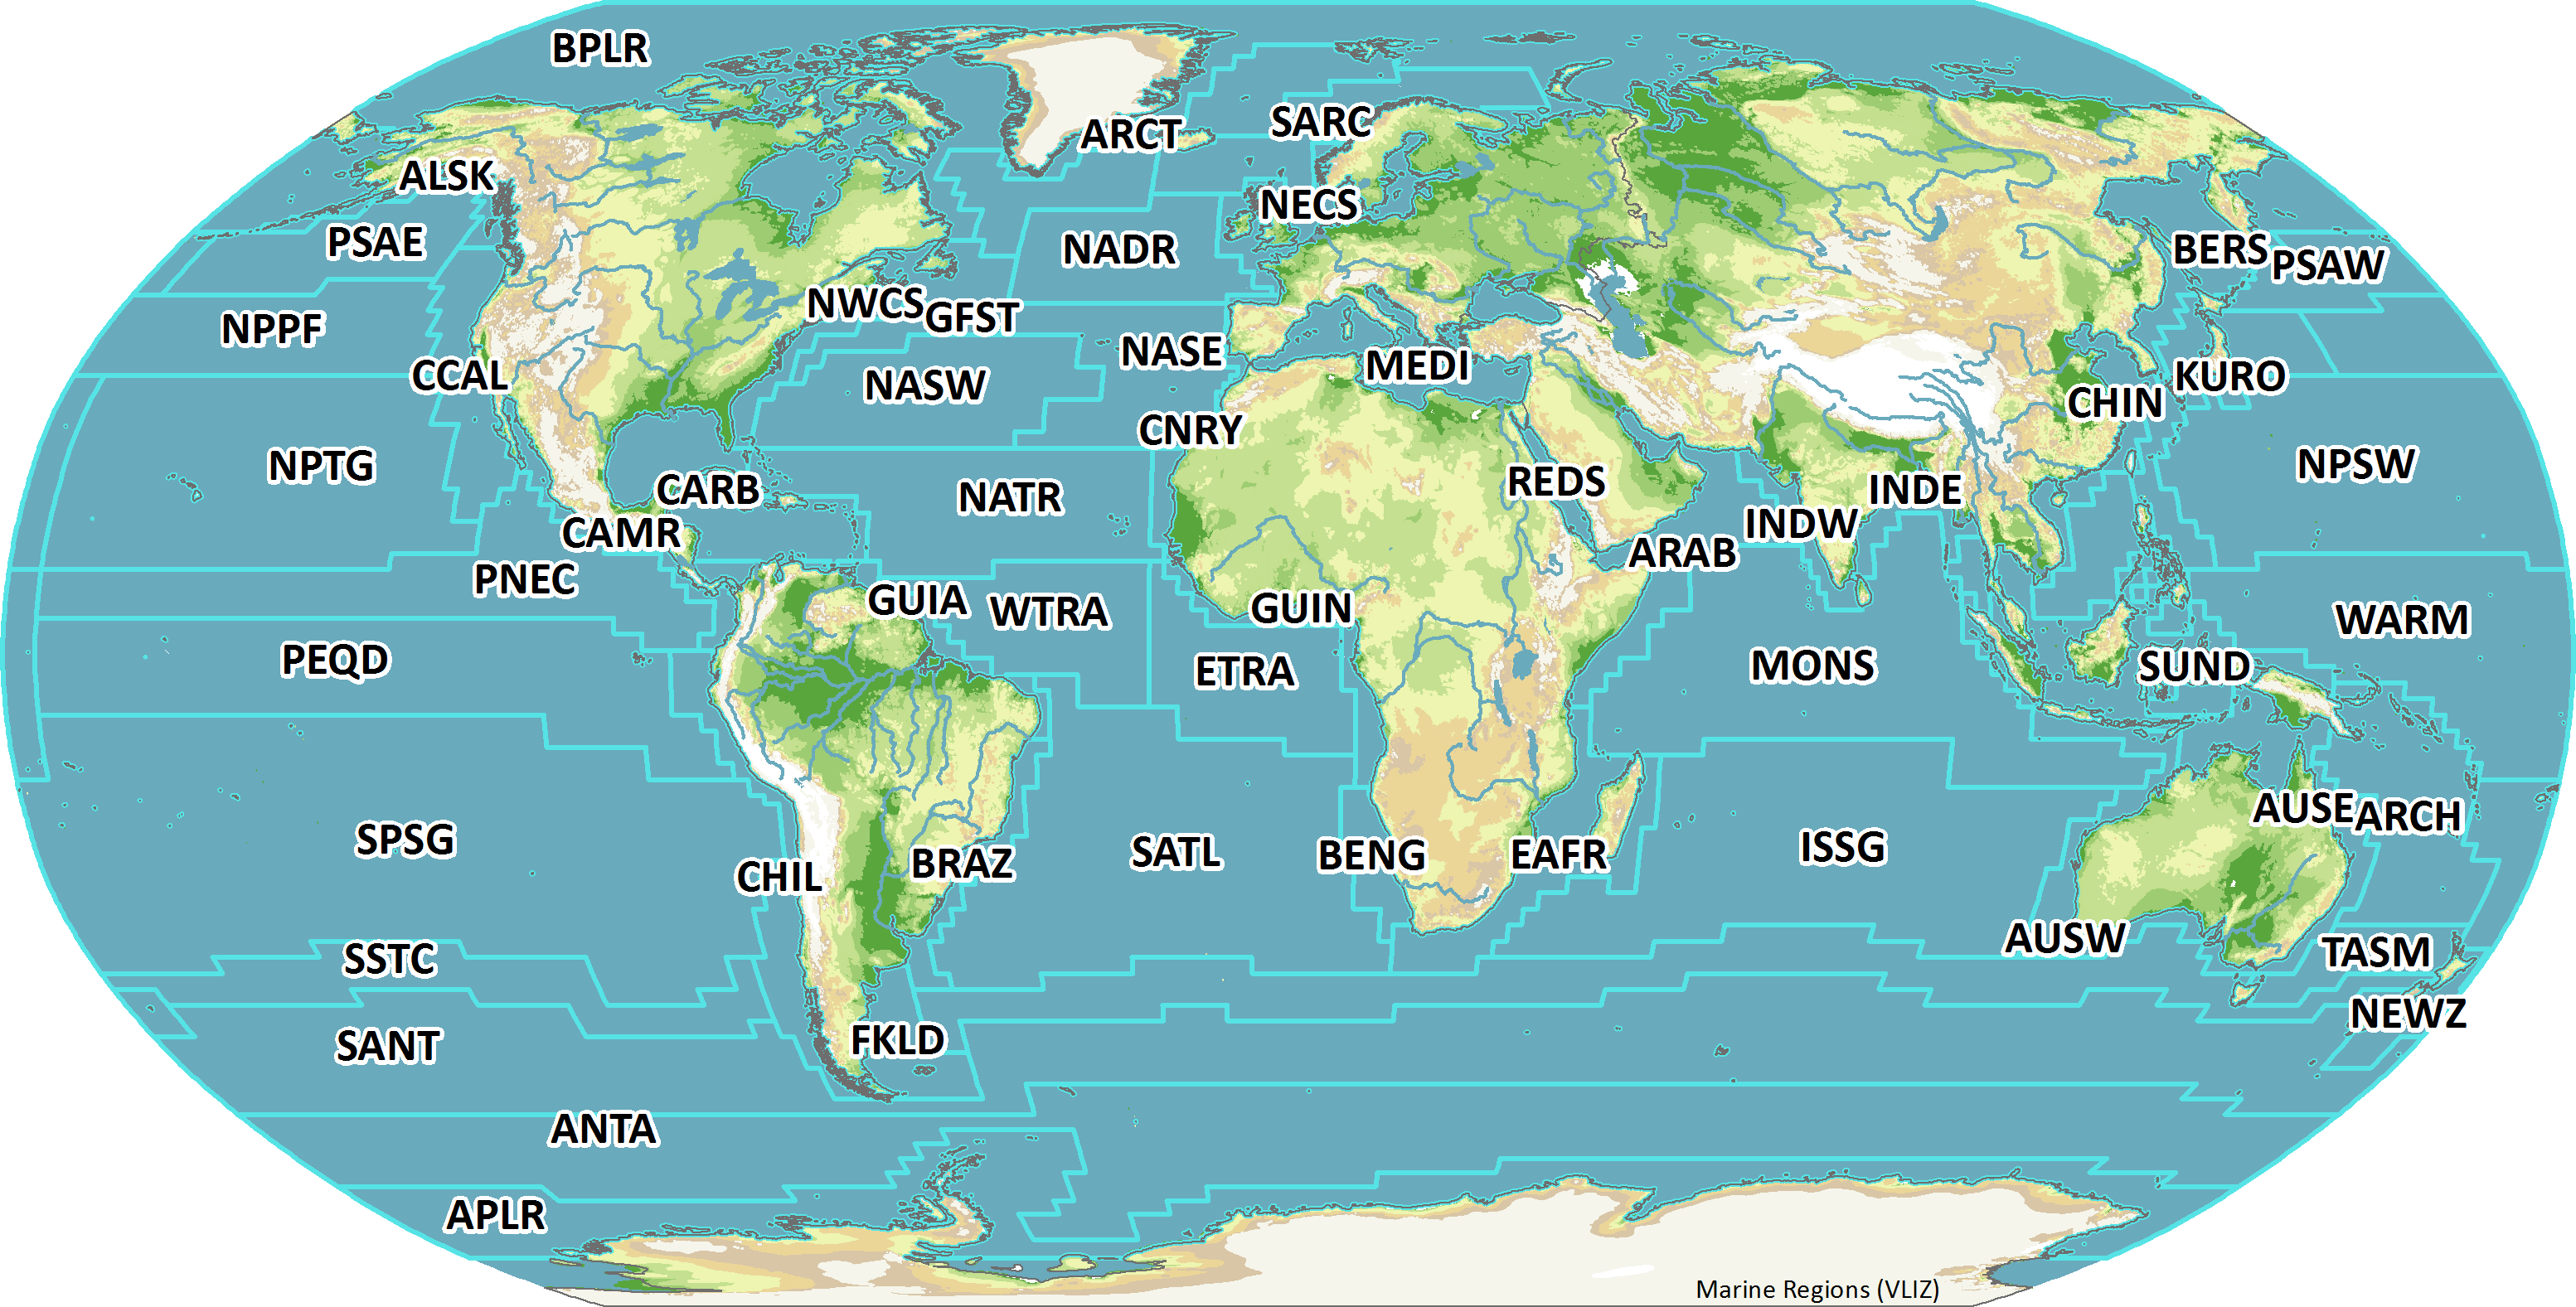
IHO Sea Areas
This dataset represents the boundaries of the major oceans and seas of the world. The source for the boundaries is the publication 'Limits of Oceans & Seas, Special Publication No. 23' published by the IHO in 1953. The dataset was composed by the Flanders Marine Data and Information Centre.
NB: The Southern Ocean is not included in the IHO publication and its limits are subject of discussion among the scientific community. The Flanders Marine Institute acknowledges the controversy around this subject but decided to include the Southern Ocean in the dataset as this term is often used by scientists working in this area. For more information, please refer to the Disclaimer.
Download IHO Sea Areas |
View Metadata
Remarks and corrections can be sent to info@marineregions.org.
Preferred citation:Flanders Marine Institute (2018). IHO Sea Areas, version 3. Available online at https://www.marineregions.org/. https://doi.org/10.14284/323.
Flanders Marine Institute (2017). IHO Sea Areas, version 2. Available online at https://www.marineregions.org/.
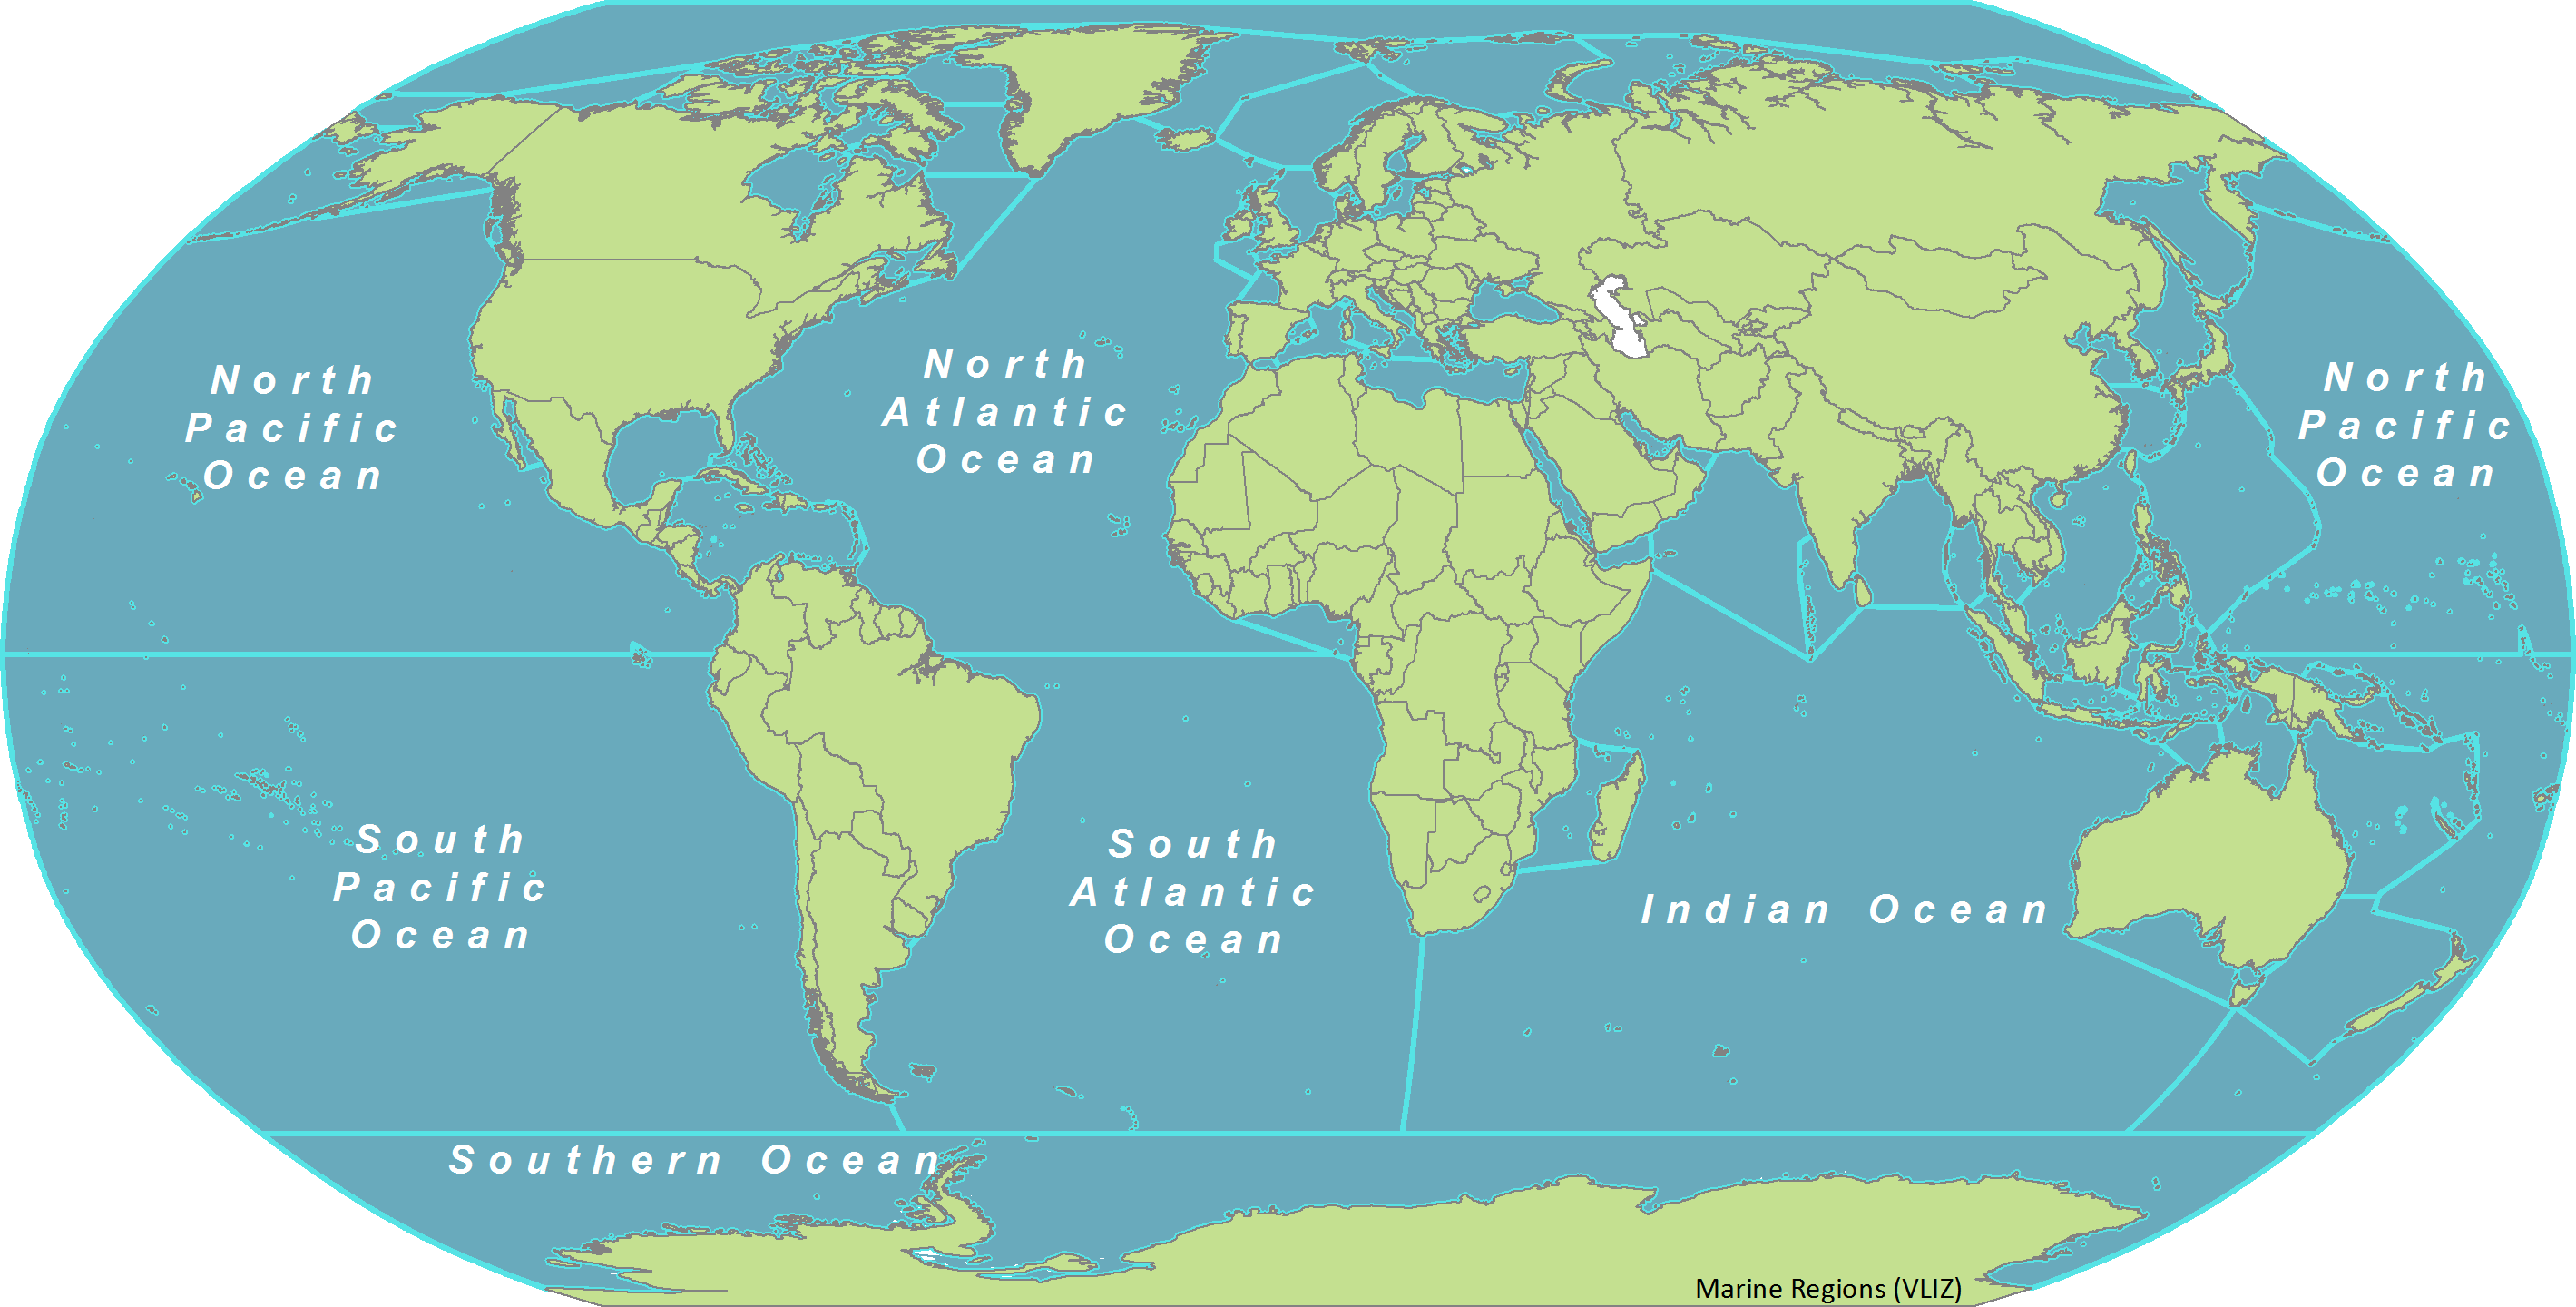
Global Oceans and Seas
This dataset represents the boundaries between the 10 main oceans and seas (Arctic Ocean, North and South Atlantic Ocean, North and South Pacific Ocean, Southern Ocean, Indian Ocean, Baltic Sea, Mediterranean Region, South China and Eastern Archipelagic Seas). The boundaries are largely based on the publication 'Limits of Oceans & Seas, Special Publication No. 23', published by the IHO in 1953. The dataset is available in World Geodetic System of 1984 (WGS84). This dataset was composed by the Flanders Marine Data Centre.
NB: The Southern Ocean is not included in the IHO publication and its limits are subject of discussion among the scientific community. The Flanders Marine Institute acknowledges the controversy around this subject but decided to include the Southern Ocean in the dataset as this term is often used by scientists working in this area.

Download Global Oceans and Seas
Remarks and corrections can be sent to info@marineregions.org.
Preferred citation:Flanders Marine Institute (2021). Global Oceans and Seas, version 1. Available online at https://www.marineregions.org/. https://doi.org/10.14284/542.
Links:
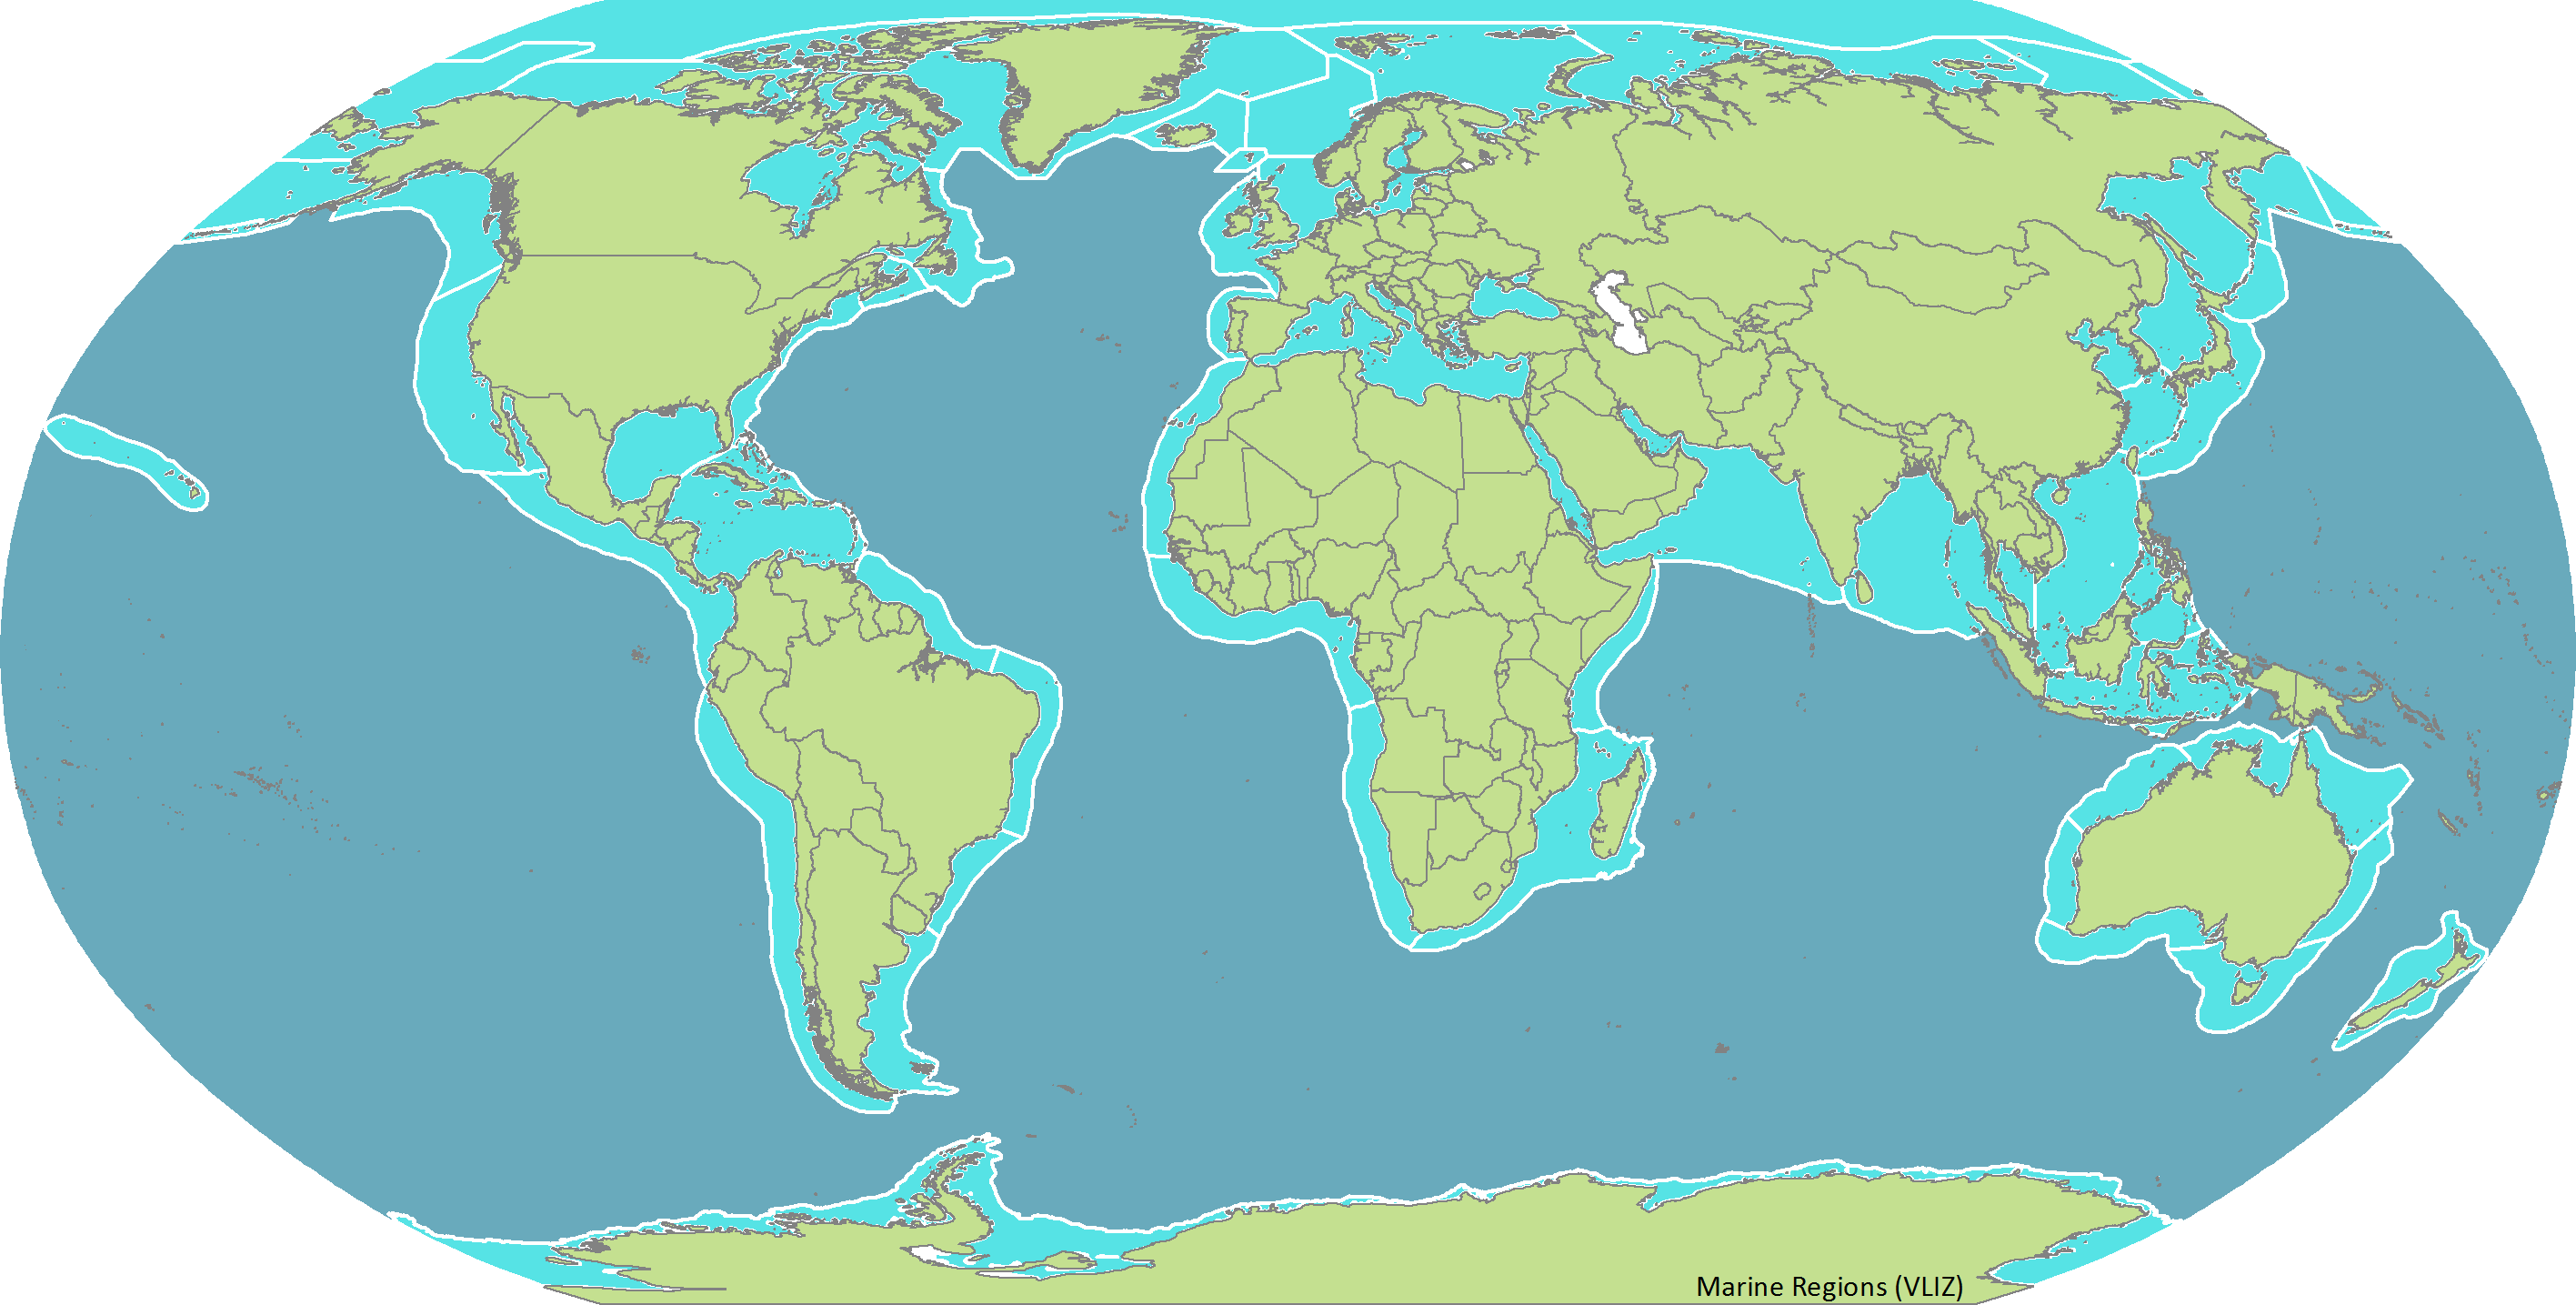
Marineregions: the intersect of the Exclusive Economic Zones and IHO areas
The maritime boundaries provide a useful tool to limit national marine areas, but do not include information on marine regional and sub regional seas. This hampers the usage of these boundaries for implementing nature conservation strategies or analysing marine biogeographic patterns. For example, a species occurring in the German EEZ can live in the North Sea, the Baltic Sea or Kattegat area. Each of these different marine areas has very distinct hydrological, oceanographic and ecological conditions.
Therefore, by combining the information on regional seas and national maritime boundaries, we can include both a environmental and managerial factor. We propose to overlay the information from the maritime boundaries (the Exclusive Economic Zones) with the IHO Sea Areas (IHO, 1953). This map including the global oceans and seas, has been drafted for hydrographic purposes, but also gives an unequivocal and acceptable distinction of the regional seas and oceans from an oceanographic point of view. The combination of these two boundaries allows us for example to create national regional sea areas for the global ocean.
Methodology
We digitised the IHO Sea Areas using the publication 'Limits of oceans and seas (IHO, 1953). The dataset, available as ArcGIS Shapefile (polygons), represents the boundaries of the major oceans and seas of the world. For the maritime boundaries, we worked with the MarBound-layer version 1 or 2, with the low resolution coastline, that matches the ESRI Country shapefiles but implemented the change history file of the latest version. Since the third version onwards, the Marbound polygon layer has a high resolution coastline (GSHHS), which has advantages, but on the other end, the size of the file makes it difficult to handle for calculating the intersections. In addition, using two shapefiles with a different resolution creates a lot of small polygons that should have been checked to decide to which Marine Area it belonged. This would have been a very time-consuming task and the result would have been an enormous file, difficult to work with within an acceptable period of time. We used the software ArcMAP 9.3 to make the new national sea boundaries intersect was, with several additional tools. The Analysis Tools Intersect to, Graphics and shapes, Calculate Geometry to, Field Calculator (ArcGIS), used to define the names and ID's using Visual Basic Expressions and the ET GeoWizards to remove multiple fields in the attribute table, to perform an Erase, Merge Layers. If one uses the intersect method and both shapefiles are not exactly the same, in this case for instance for the coastline, we would create again lots of small polygons to analyze one by one. Although we did our best to minimize this, by using a lower coastline resolution, the small parts still appeared. If one uses the Intersect Tool, the result contains only the overlapping parts of both shapefiles. In the output of the Intersect Tool, only the EEZ features remain (Figure 6), but we also need the open sea oceans. Therefore the ET Geowizards Erase Tools was used, to delete from a rectangle all land and EEZ areas, so only the 'open seas' remained. This layer, with the result of the intersect were merged (Figure 8). Areas with the same Exclusive Economic Zone and the same sea basin were merged (with the Editor in ArcMap, except when both features are not connected to each other (single part features).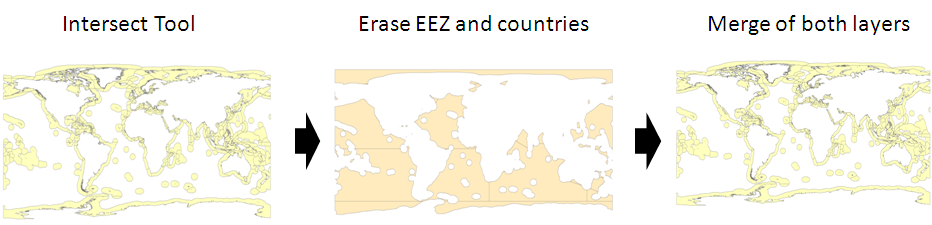
The last step was calculating the surfaces of each Marine Area. Different coordinate systems exist to perform geometric calculations, some are more precise then others, we opt for the method proposed by Jenness Enterprises to calculate surfaces on a sphere.
Nomenclature
| SEA | EEZ | Marine Region |
|---|---|---|
| Mediterranean Sea - Western Basin | Italian Exclusive Economic Zone | Italian part of the Mediterranean Sea - Western Basin |
| Mediterranean Sea - Eastern Basin | Italian Exclusive Economic Zone | Italian part of the Mediterranean Sea - Eastern Basin |
| Ligurian Sea | Italian Exclusive Economic Zone | Italian part of the Ligurian Sea |
| Tyrrhenian Sea | Italian Exclusive Economic Zone | Italian part of the Tyrrhenian Sea |
| Adriatic Sea | Italian Exclusive Economic Zone | Italian part of the Adriatic Sea |
| Ionian Sea | Italian Exclusive Economic Zone | Italian part of the Ionian Sea |
Polygon creation by merging of both layers
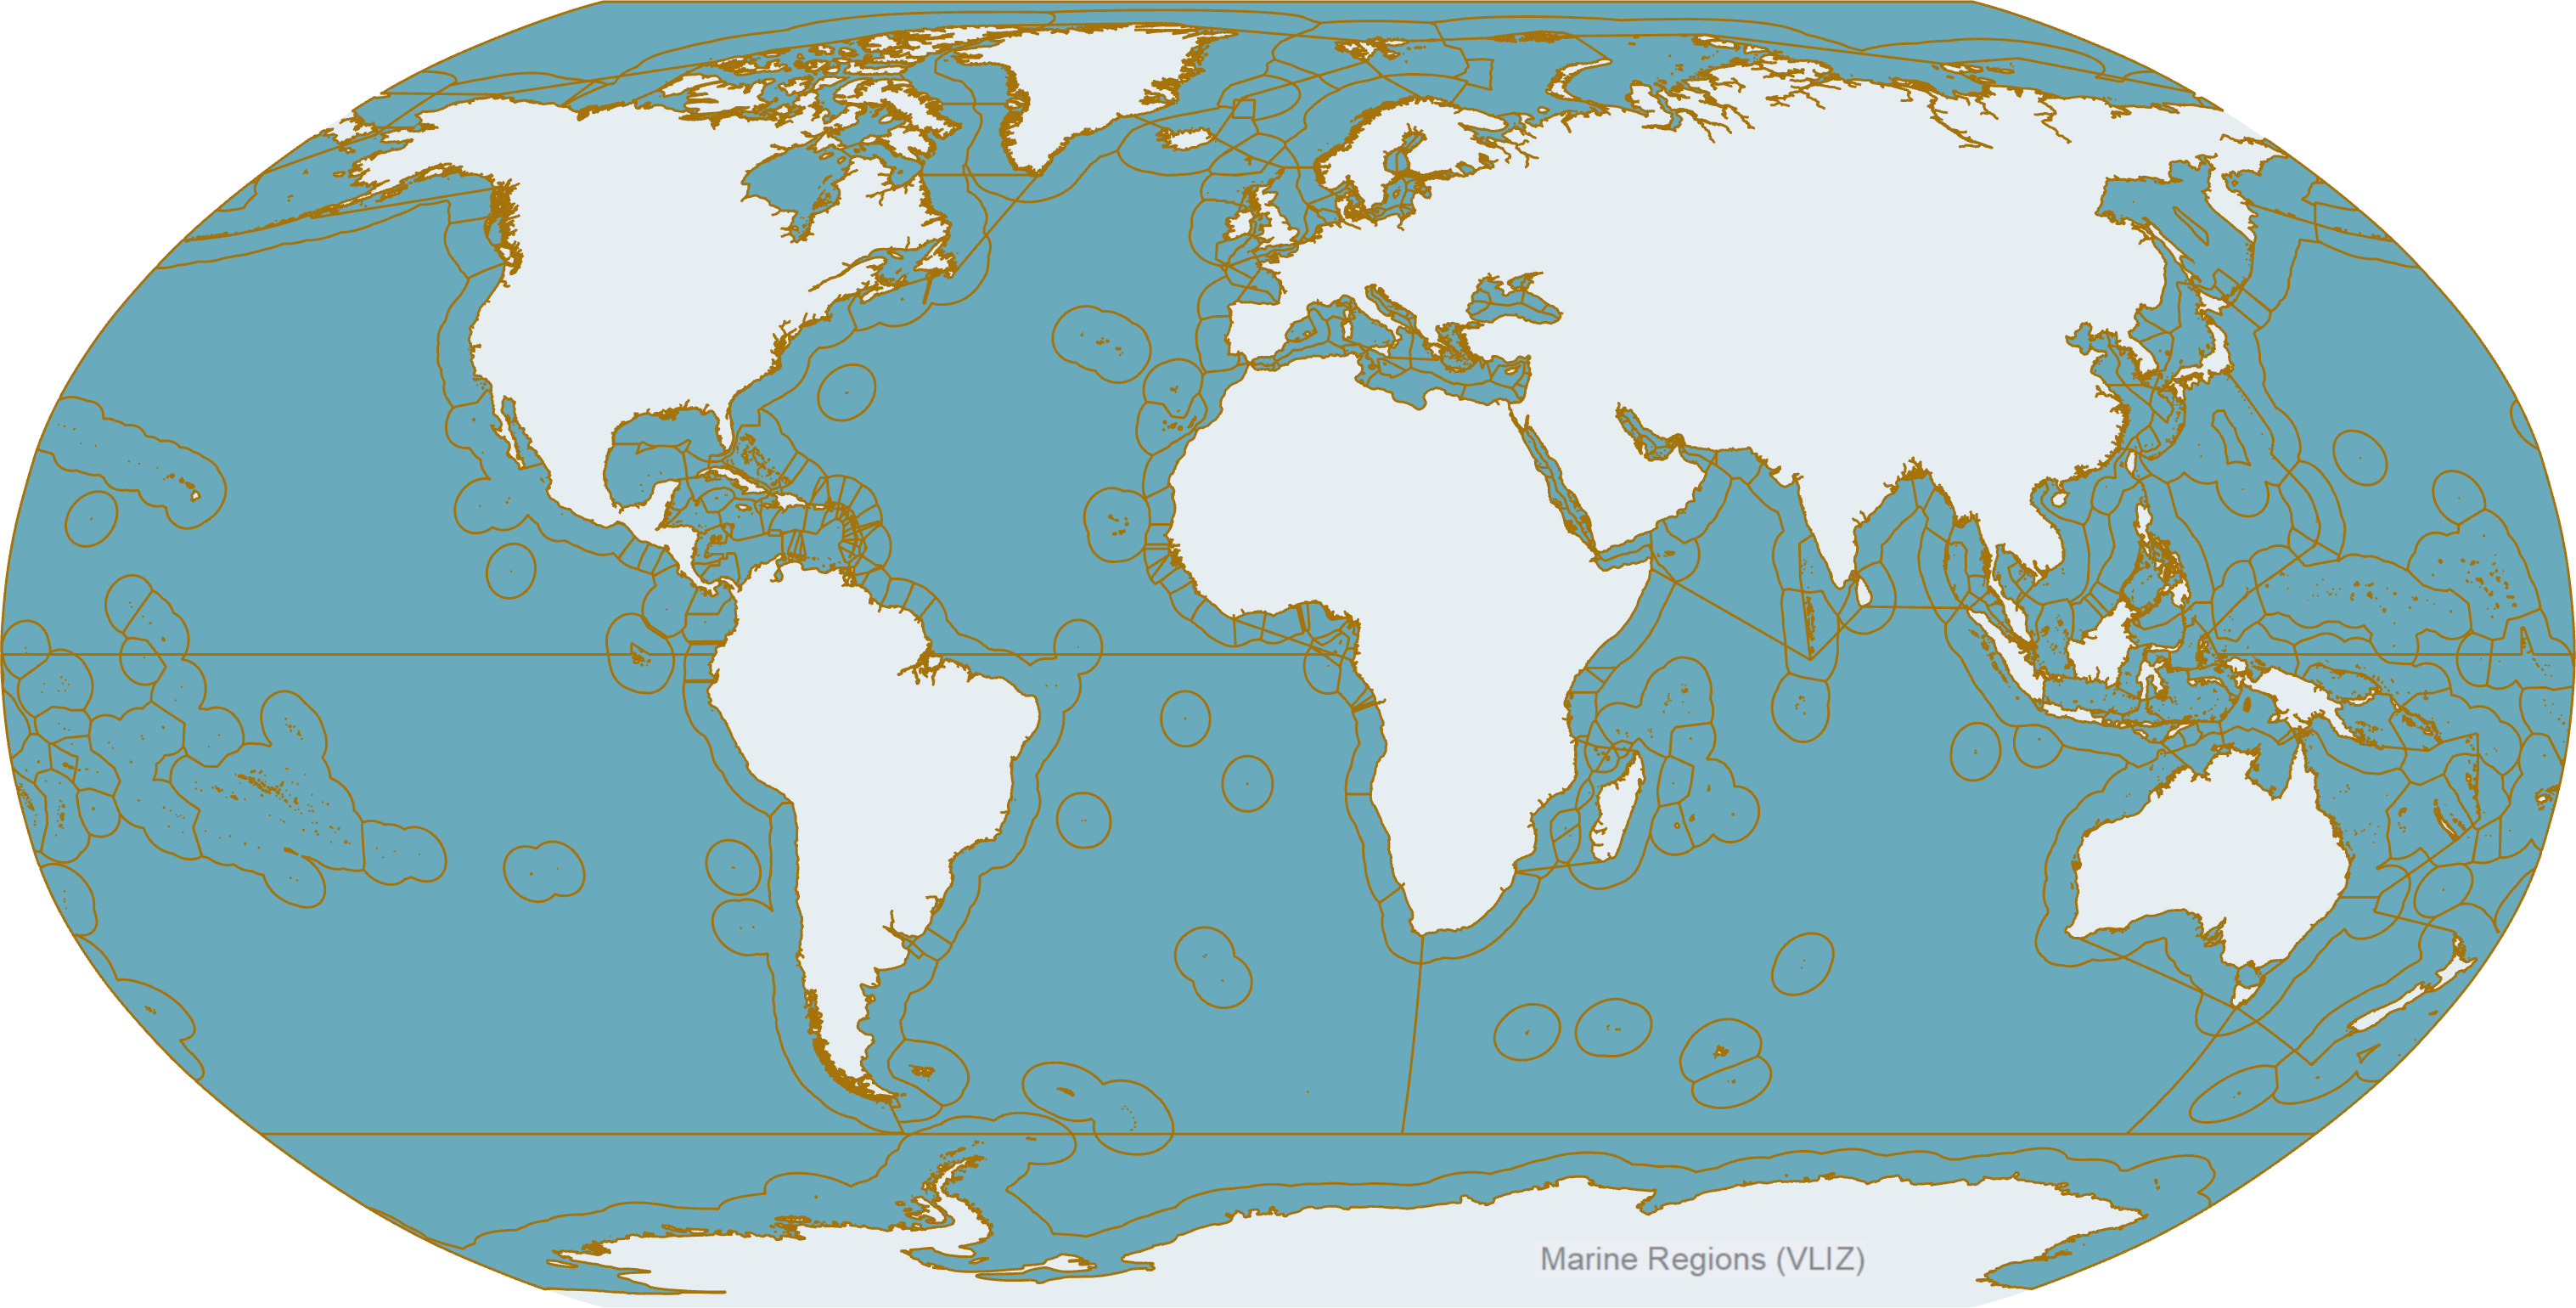
The result of all this is a shapefile with 525 features.
Download intersect IHO/EEZ
Remarks and corrections can be sent to info@marineregions.org.
Preferred citation:
Flanders Marine Institute (2024). The intersect of the Exclusive Economic Zones and IHO sea areas, version 5. Available online at https://www.marineregions.org/.https://doi.org/10.14284/699
Flanders Marine Institute (2020). The intersect of the Exclusive Economic Zones and IHO sea areas, version 4. Available online at https://www.marineregions.org/.https://doi.org/10.14284/402
Flanders Marine Institute (2018). The intersect of the Exclusive Economic Zones and IHO sea areas, version 3. Available online at https://www.marineregions.org/. https://doi.org/10.14284/324
Flanders Marine Institute (2012). Intersect of IHO Sea Areas and Exclusive Economic Zones (version 2). Available online at https://www.marineregions.org/.
Flanders Marine Institute (2010). Intersect of IHO Sea Areas and Exclusive Economic Zones (version 1). Available online at https://www.marineregions.org/.
Marine and land zones: the union of world country boundaries and EEZs
This dataset combines the boundaries of the world countries and the Exclusive Economic Zones of the world. It was created by combining the ESRI world country database and the EEZ V12 dataset.
Remarks and corrections can be sent to info@marineregions.org.
Preferred citation:
Flanders Marine Institute (2024). Union of the ESRI Country shapefile and the Exclusive Economic Zones (version 4). Available online at https://www.marineregions.org/. https://doi.org/10.14284/698. Consulted on 2026-07-29.
The SeaVoX Salt and Fresh Water Body Gazetteer
The data set consists of a polygon file defining the limits of water bodies from the SeaVoX Salt and Fresh Water Body Gazetteer.
SeaVoX is a combined SeaDataNet and MarineXML vocabulary content governance group, it is moderated by BODC.
This polygon data set defines the geographic extent of the terms specified by the SeaVoX vocabulary governance to describe coherent regions of the hydrosphere. It includes land masses enclosing freshwater bodies. The coastline data set used in the shapefile is taken from the World Vector Shoreline data set (scale 1:250,000).
Reference for the data set: British Oceanographic Data Centre (BODC), United Kingdom; (2023): Polygon dataset of the extent of water bodies from the SeaVoX Salt and Fresh Water Body Gazetteer (v19). Available online at https://www.marineregions.org/. https://doi.org/10.14284/590
The data file follows a hierarchical structure with each region consisting of one or more polygons. This approach was adopted to avoid the need to have overlapping polygons in regions where a sea area included a number of sub-regions, for example the Mediterranean Sea includes the Aegean Sea, Ionian Sea etc. The following gives the level in the structure at which particular regions, which consist of more than one polygon can be found. This level in the structure is given by the polygon's attributes.
Download Seavox Sea Areas | View Metadata
Links:
References:
- British Oceanographic Data Centre (BODC), United Kingdom; (2023): Polygon dataset of the extent of water bodies from the SeaVoX Salt and Fresh Water Body Gazetteer (v19). Available online at https://www.marineregions.org/. https://doi.org/10.14284/590
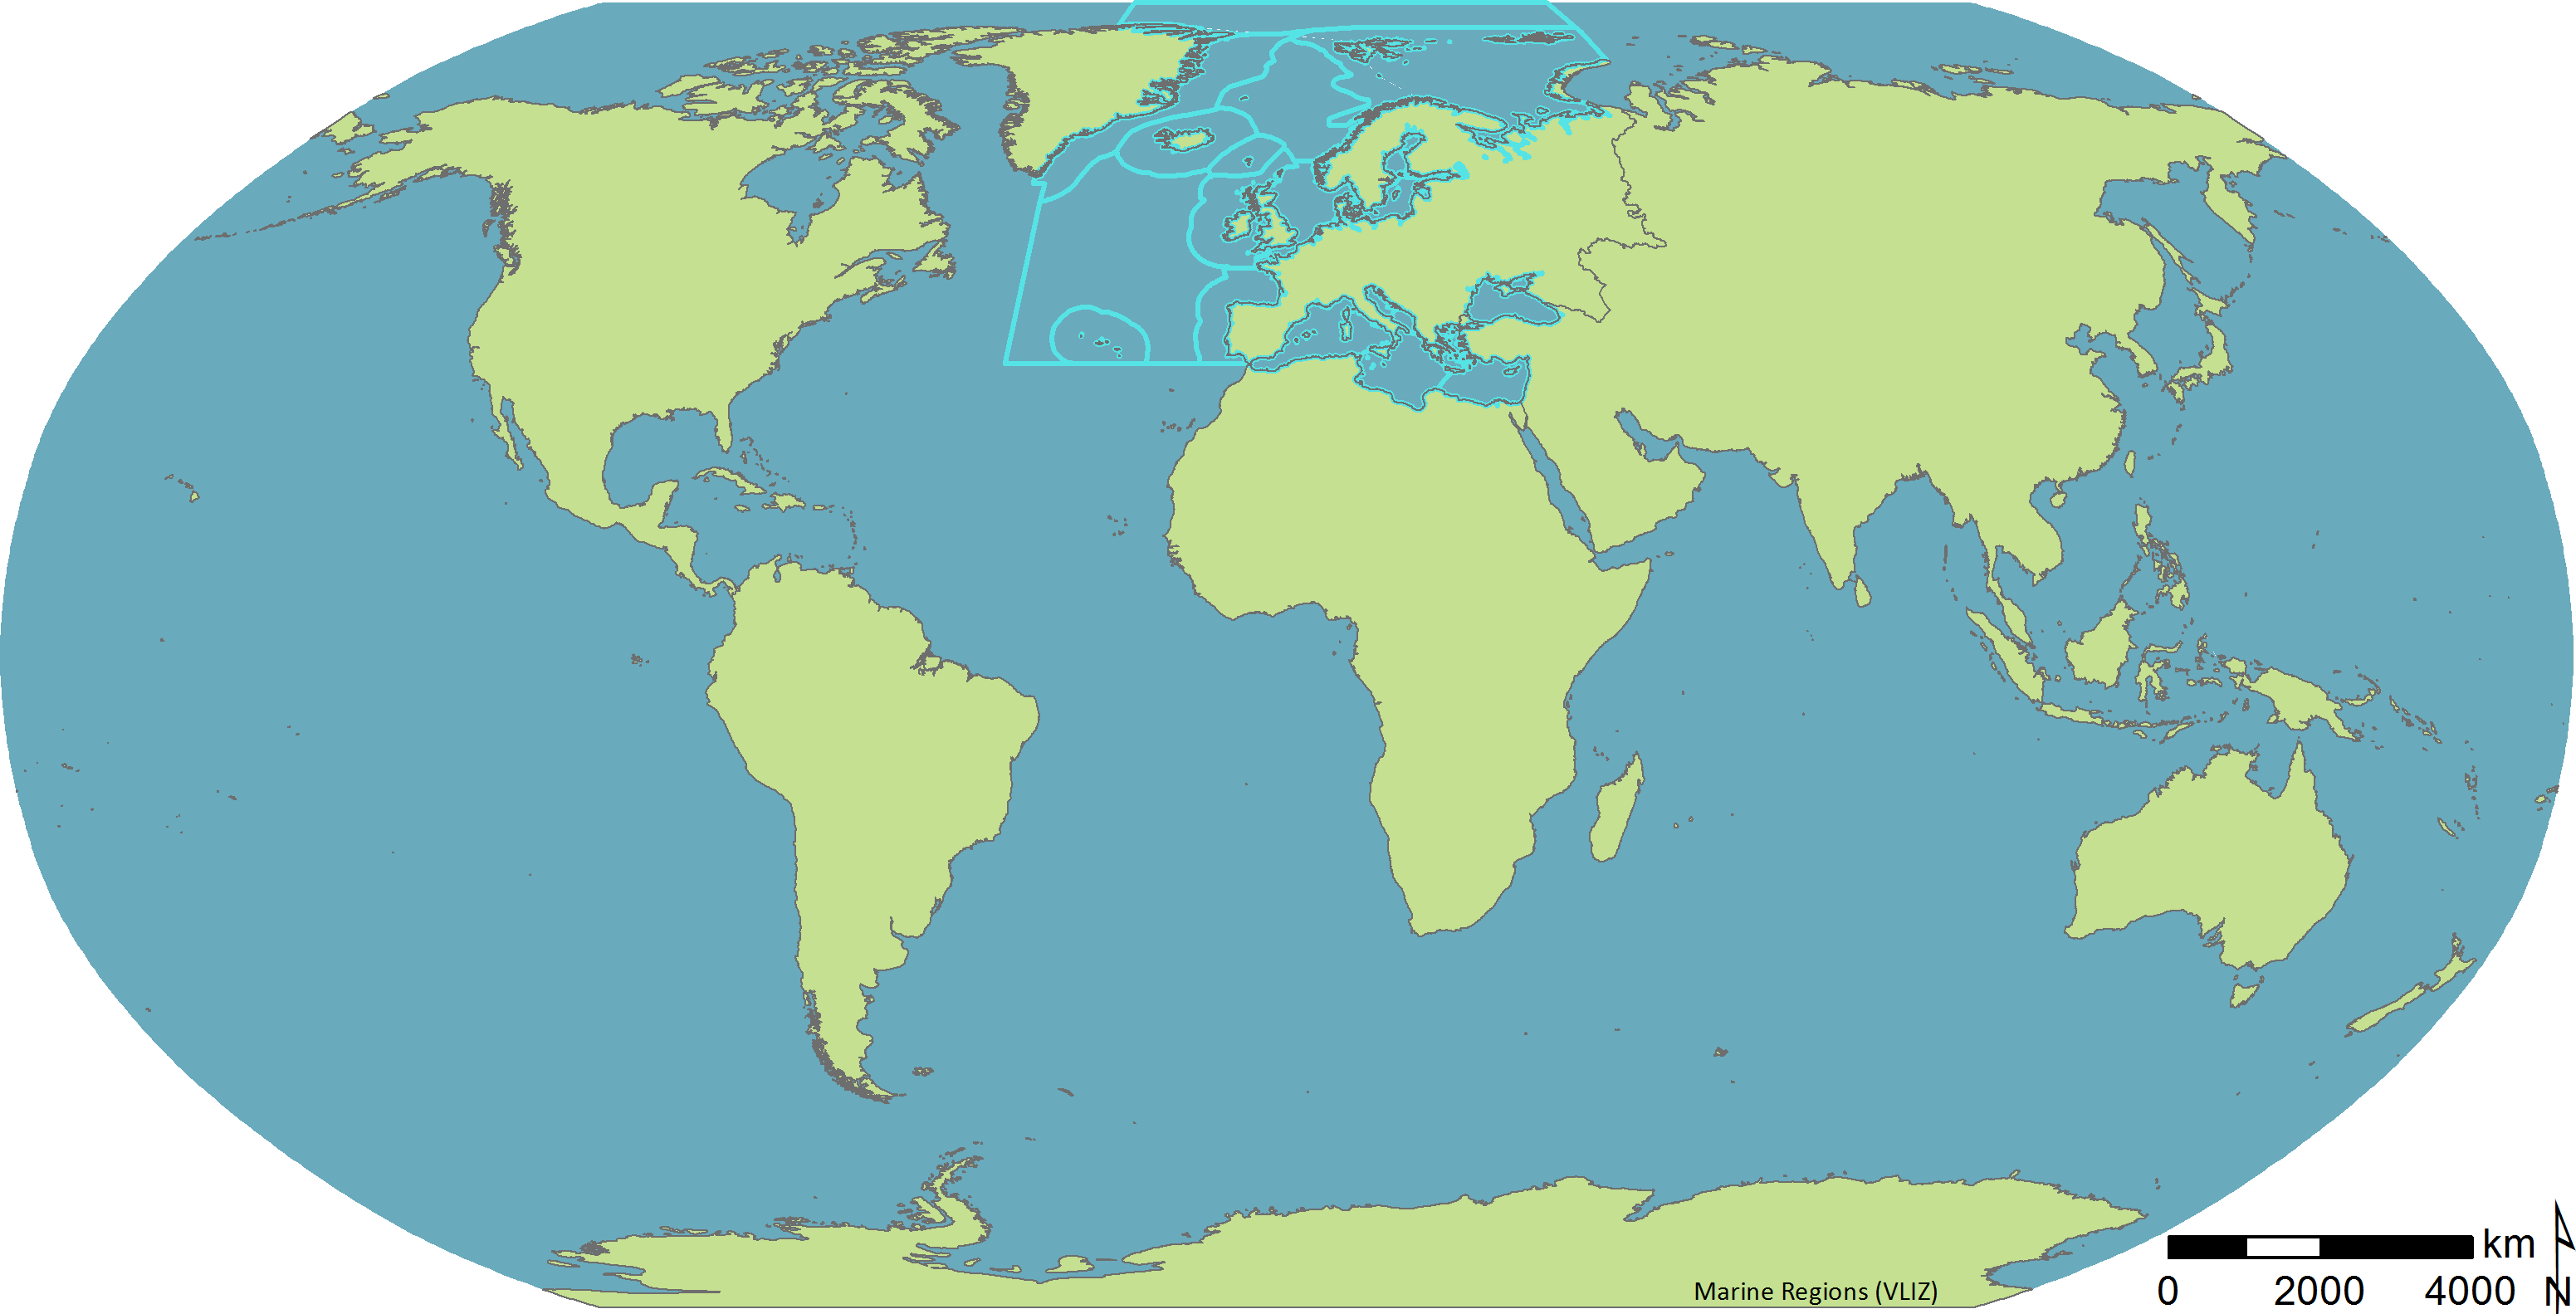
OSPAR Boundaries and Regions
A shapefile containing the external boundary and internal region boundary lines to describe the OSPAR area and a shapefile to describe the OSPAR Regions.
Download OSPAR Boundaries | View Metadata
Links:
Statistics on Marbound and IHO (Costello et al., 2011) (Not integrated in gazetteer)
Depth and topography directly and indirectly influence most ocean environmental conditions, including light penetration and photosynthesis, sedimentation, current movements and stratification, and thus temperature and oxygen gradients. These parameters are thus likely to influence species distribution patterns and productivity in the oceans. They may be considered the foundation for any standardised classification of ocean ecosystems, and important correlates of metrics of biodiversity
(e.g. species richness and composition, fisheries). While statistics on ocean depth and topography are often quoted, how they were derived is rarely cited, and unless calculated using the same spatial resolution the resulting statistics will not be strictly comparable. We provide such statistics using the best available resolution (1-minute) global bathymetry, and open source digital maps of the world's seas and oceans and countries' Exclusive Economic Zones, using a standardised methodology. We created
a terrain map and calculated sea surface and seabed area, volume, and mean, standard deviation, maximum and minimum, of both depth and slope.
Download the results
References:
- Costello, M.J.; Cheung, A.; De Hauwere, N. (2011). The surface area, and the seabed area, volume, depth, slope, and topographic variation for the world's seas, oceans and countries. Environmental Science & Technology https://www.vliz.be/en/imis?module=ref&refid=202017
- Costello, M.J.; Smith, M.; Fraczek, W. (2015). Correction to Surface Area and the Seabed Area, Volume, Depth, Slope, and Topographic Variation for the World's Seas, Oceans, and Countries. Environmental Science & Technology https://www.vliz.be/en/imis?module=ref&refid=247223
- The surface area, and the seabed area, volume, depth, slope, and topographic variation for the world's seas, oceans and countries. Available online at https://www.marineregions.org/. Consulted on 2026-07-29.
Ecological classifications
Large Marine Ecosystems of the World
LMEs are natural regions of ocean space encompassing coastal waters from river basins and estuaries to the seaward boundary of continental shelves and the outer margins of coastal currents. They are relatively large regions of 200,000 km2 or greater, the natural boundaries of which are based on four ecological criteria: bathymetry, hydrography, productivity, and trophically related populations. The theory, measurement, and modeling relevant to monitoring the changing states of LMEs are imbedded in reports on ecosystems with multiple steady states, and on the pattern formation and spatial diffusion within ecosystems. The concept that critical processes controlling the structure and function of biological communities can best be addressed on a regional basis has been applied to the ocean by using LMEs as the distinct units for marine resources assessment, monitoring, and management.
Credit: Large Marine Ecosystem Program NOAA-Fisheries Narragansett Laboratory Narragansett, R.I. 02882.
Go To LME website | View Metadata
Links: IW:LEARN Spatial Lab
Longhurst Provinces
The dataset represents the division of the world oceans into provinces as defined by Longhurst (1995; 1998; 2006). The division has been based on the prevailing role of physical forcing as a regulator of phytoplankton distribution. The dataset contains the initial static boundaries developed at the Bedford Institute of Oceanography, Canada.
Note that the boundaries of these provinces are not fixed in time and space, but are dynamic and move under seasonal and interannual changes in physical forcing. At the first level of reduction, Longhurst recognised four principal biomes: the Polar biome, the Westerlies biome, the Trade winds biome, and the Coastal biome. These four biomes are recognised in every major ocean basin.
At the next level of reduction, the ocean basins are divided into provinces, roughly ten for each basin.
These regions provide a template for data analysis or for making parameter assignments on a global scale.
Please refer to Longhurst's publications when using these shapefiles.
A summary table has been prepared by Mathias Taeger and David Lazarus, Museum für Naturkunde, Berlin (2010-03-26). This table makes it easier to relate the classification of Longhurst to the original quantitative parameters used to create it. Productivity values are from the table in Longhurst, 1995, Chlorophyll values; photic depth and mixed layer depth originate from graphs in Longhurst, 1998. The sea temperature at 0 and 50 m are from the World Ocean Atlas (2005), average values were calculated in ArcGIS. Each parameter value was set into 5 equal intervals. Download summary table.
Download Longhurst Provinces Shapefile | View Metadata
Remarks and corrections can be sent to info@marineregions.org.
Preferred citation:
Flanders Marine Institute (2009). Longhurst Provinces. Available online at https://www.marineregions.org/. Consulted on 2026-07-29.
References:
- Longhurst, A.R et al. (1995). An estimate of global primary production in the ocean from satellite radiometer data. J. Plankton Res. 17, 1245-1271
- Longhurst, A.R. (1995). Seasonal cycles of pelagic production and consumption. Prog. Oceanogr. 36, 77-167
- Longhurst, A.R. (1998). Ecological Geography of the Sea. Academic Press, San Diego. 397p. (IMIS)
- Longhurst, A.R. (2006). Ecological Geography of the Sea. 2nd Edition. Academic Press, San Diego, 560p.
Marine Ecoregions of the World, MEOW (Spalding et al., 2007)
MEOW is a biogeographic classification of the world's coasts and shelves. It is the first ever comprehensive marine classification system with clearly defined boundaries and definitions and was developed to closely link to existing regional systems. The ecoregions nest within the broader biogeographic tiers of Realms and Provinces.
MEOW represents broad-scale patterns of species and communities in the ocean, and was designed as a tool for planning conservation across a range of scales and assessing conservation efforts and gaps worldwide. The current system focuses on coast and shelf areas (as this is where the majority of human activity and conservation action is focused) and does not consider realms in pelagic or deep benthic environment. It is hoped that parallel but distinct systems for pelagic and deep benthic biotas will be devised in the near future.
The project was led by The Nature Conservancy (TNC) and the World Wildlife Fund (WWF), with broad input from a working group representing key NGO, academic and intergovernmental conservation partners.
(source: WWF - Marine Ecoregions of the World)
Note: The inland boundaries of the ecoregions extend far inland - a convention to ensure inclusion of any coastline and estuarine/lagoonal systems which may be derived from different map sources. For visualisations in the Marine Regions gazetteer, the areas inland have been removed from the shapefile.
Go to the website | View Metadata
References:
- Spalding, M. D. Fox, H. E. Allen, G. R. Davidson, N. Ferdana, Z. A. Finlayson, M. Halpern, B. S. Jorge, M. A. Lombana, A. Lourie, S. A., (2007). Marine Ecoregions of the World: A Bioregionalization of Coastal and Shelf Areas. Bioscience 2007, VOL 57; numb 7, pages 573-584. doi: 10.1641/B570707
Read the article
Freshwater Ecoregions of the World, FEOW (The Nature Conservancy and World Wildlife Fund, Inc., 2008)
Freshwater Ecoregions of the World, (FEOW) provides a new global biogeographic regionalization of the Earth's freshwater biodiversity. Covering virtually all freshwater habitats on Earth, this first-ever ecoregion map, together with associated species data, is a useful tool for underpinning global and regional conservation planning efforts, particularly to identify outstanding and imperiled freshwater systems; for serving as a logical framework for large-scale conservation strategies; and for providing a global-scale knowledge base for increasing freshwater biogeographic literacy.
The freshwater ecoregion map serves as a complement to the global terrestrial and marine ecoregion maps and differs from them in that freshwater species (primarily fish) and freshwater processes drove the map delineation.
The freshwater ecoregion map encompasses 426 units, whose boundaries generally - though not always - correspond with those of watersheds (also known as drainage basins or catchments). Within individual ecoregions there will be turnover of species, such as when moving up or down a river system, but taken as a whole an ecoregion will typically have a distinct evolutionary history and/or ecological processes. Ecoregions are delineated based on the best available information, but data describing freshwater species and ecological processes are characterized by marked gaps and variation in quality, and improved information in the future may warrant map revisions.
(source: Freshwater Ecoregions of the World)
Links:
ICES Ecoregions
Delineation of the ICES Ecoregions was originally described in ICES Advice ACFM/ACE report (2004).
In the present updated version, the delineation has been updated to account for additional policy objectives and reconciling of legislation (eg the MSFD and the EU water and habitats directives).
The differences are based on the four principles:
- Within the EU accept the MSFD regional and sub-regional definitions.
- Separate Icelandic Seas from those around Greenland.
- Use Large Marine Ecosystem units to define the Arctic Ocean.
- Use the accepted Norwegian regional management plans definitions of the Norwegian and Barents Seas.
Download ICES Ecoregions | View Metadata
Links:
IOS Zooplankton Regions
This set of polygons is used to sort and/or merge zooplankton species into regions of narrow or broad interest for biomass and abundance analysis. The results are reported yearly in 'State of the physical, biological and selected fishery resources of Pacific Canadian marine ecosystems'.
Citations:
- Last report:
Chandler, P.C., King, S.A., and Perry, R.I. (Eds.). 2016. State of the physical, biological and selected fishery resources of Pacific Canadian marine ecosystems in 2015. Can. Tech. Rep. Fish. Aquat. Sci. 3179: viii + 230 p.
Galbraith, M., Young, K., Perry, I. 2016. Zooplankton along the B.C. Continental Margin, 2015
DFO Marine Bioregions (Department Fisheries and Oceans Canada)
The spatial planning framework for Canada's national network of Marine Protected Areas (MPAs) is comprised of 13 ecologically defined bioregions that cover Canada's oceans and the Great Lakes.
Note that the geographic boundaries for the bioregions are fuzzy and may change based on ecosystemic conditions.
Detailed descriptions and discussions on the federal network of marine bioregions can be found in:
- DFO. 2009. Development of a Framework and Principles for the Biogeographic Classification of Canadian Marine Areas. DFO Can. Sci. Advis. Sec. Sci. Advis. Rep. 2009/056.
- DFO. 2010. Proceedings of a National Science Advisory Process to Provide Guidance on the Development of a Framework and Principles for the Biogeographic Classification of Canadian Marine Areas; 15-16 June 2009. DFO Can. Sci. Advis. Sec. Proceed. Ser. 2009/039.
- National Framework for Canada's Network of Marine Protected Areas.
More information:
- Access the data (and download as kml)

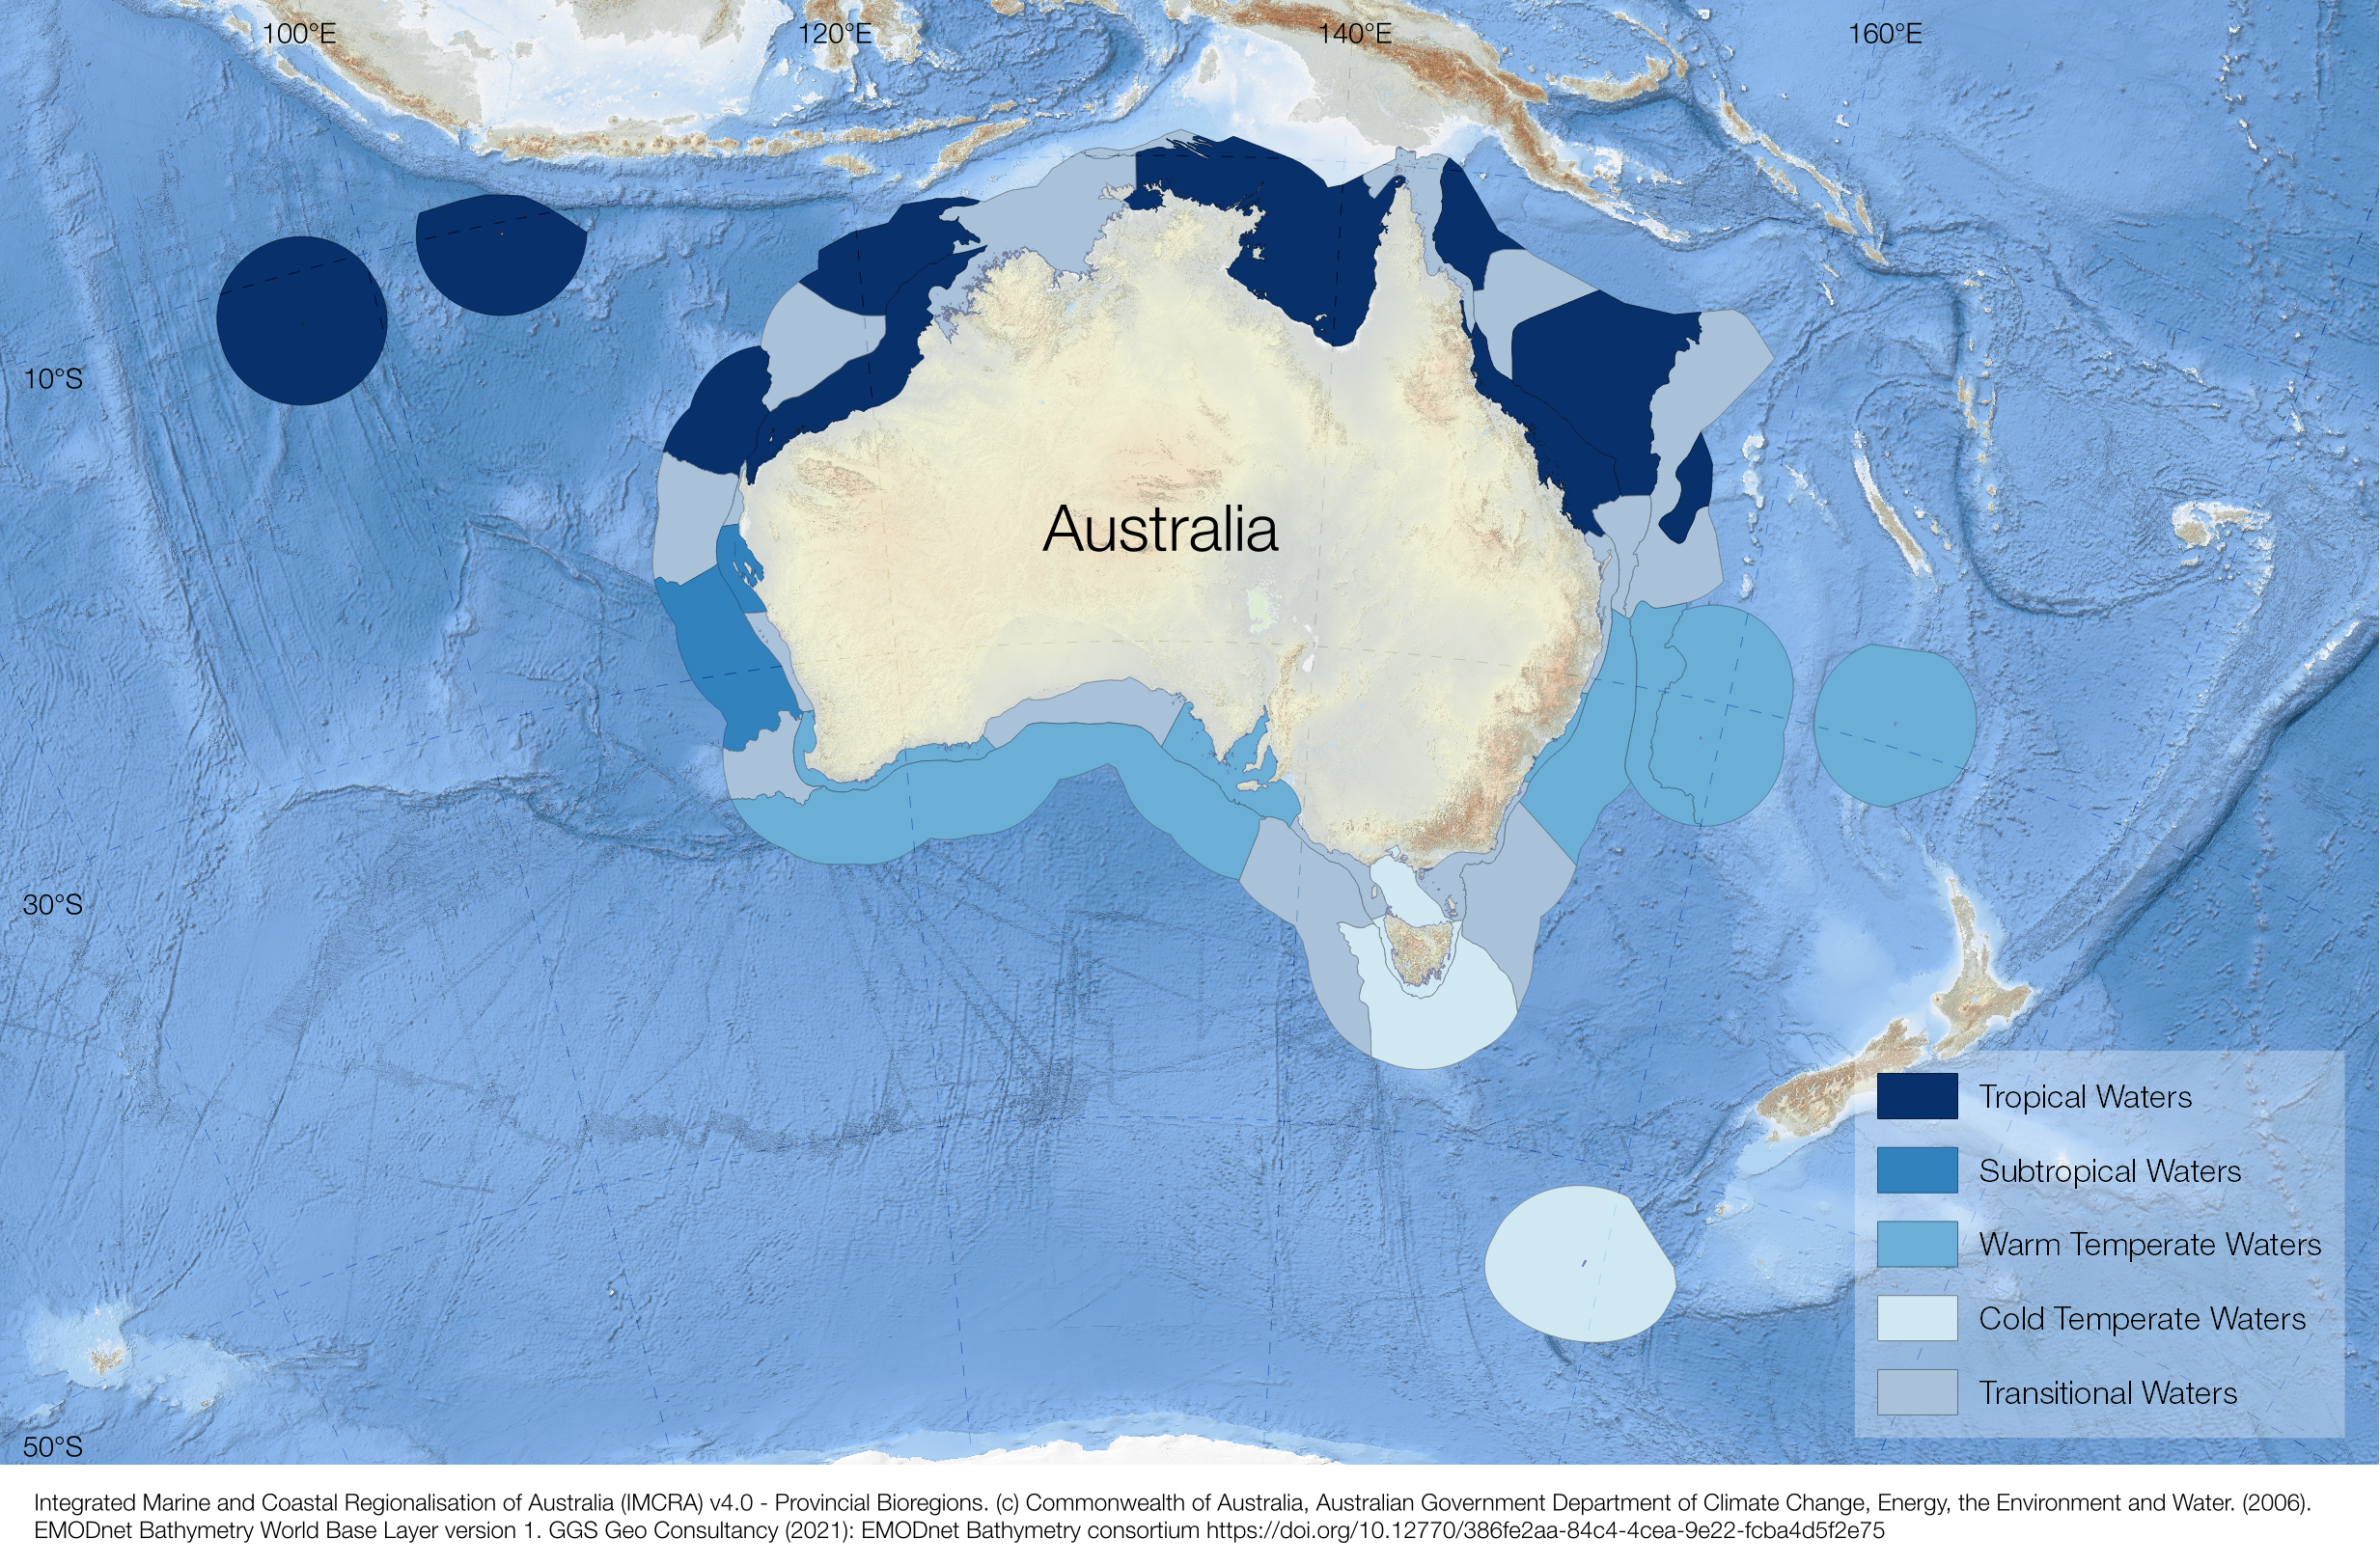
IMCRA v4.0 Provincial Bioregions (Australian Government Department of Climate Change, Energy, the Environment and Water)
The Integrated Marine and Coastal Regionalisation of Australia (IMCRA) is a geospatial framework used to classify Australia’s marine and coastal environments into bioregions for regional planning and management. The provincial bioregions represent broad benthic biogeographic patterns, based mainly on the distribution of demersal fish and supported by geophysical classification.
The IMCRA v4.0 provincial bioregions include provinces and transition zones across tropical, subtropical, warm temperate and cold temperate Australian waters. Provinces are characterised by endemic fish species, while transition zones capture areas where species ranges overlap.
More information:
Fishing zones
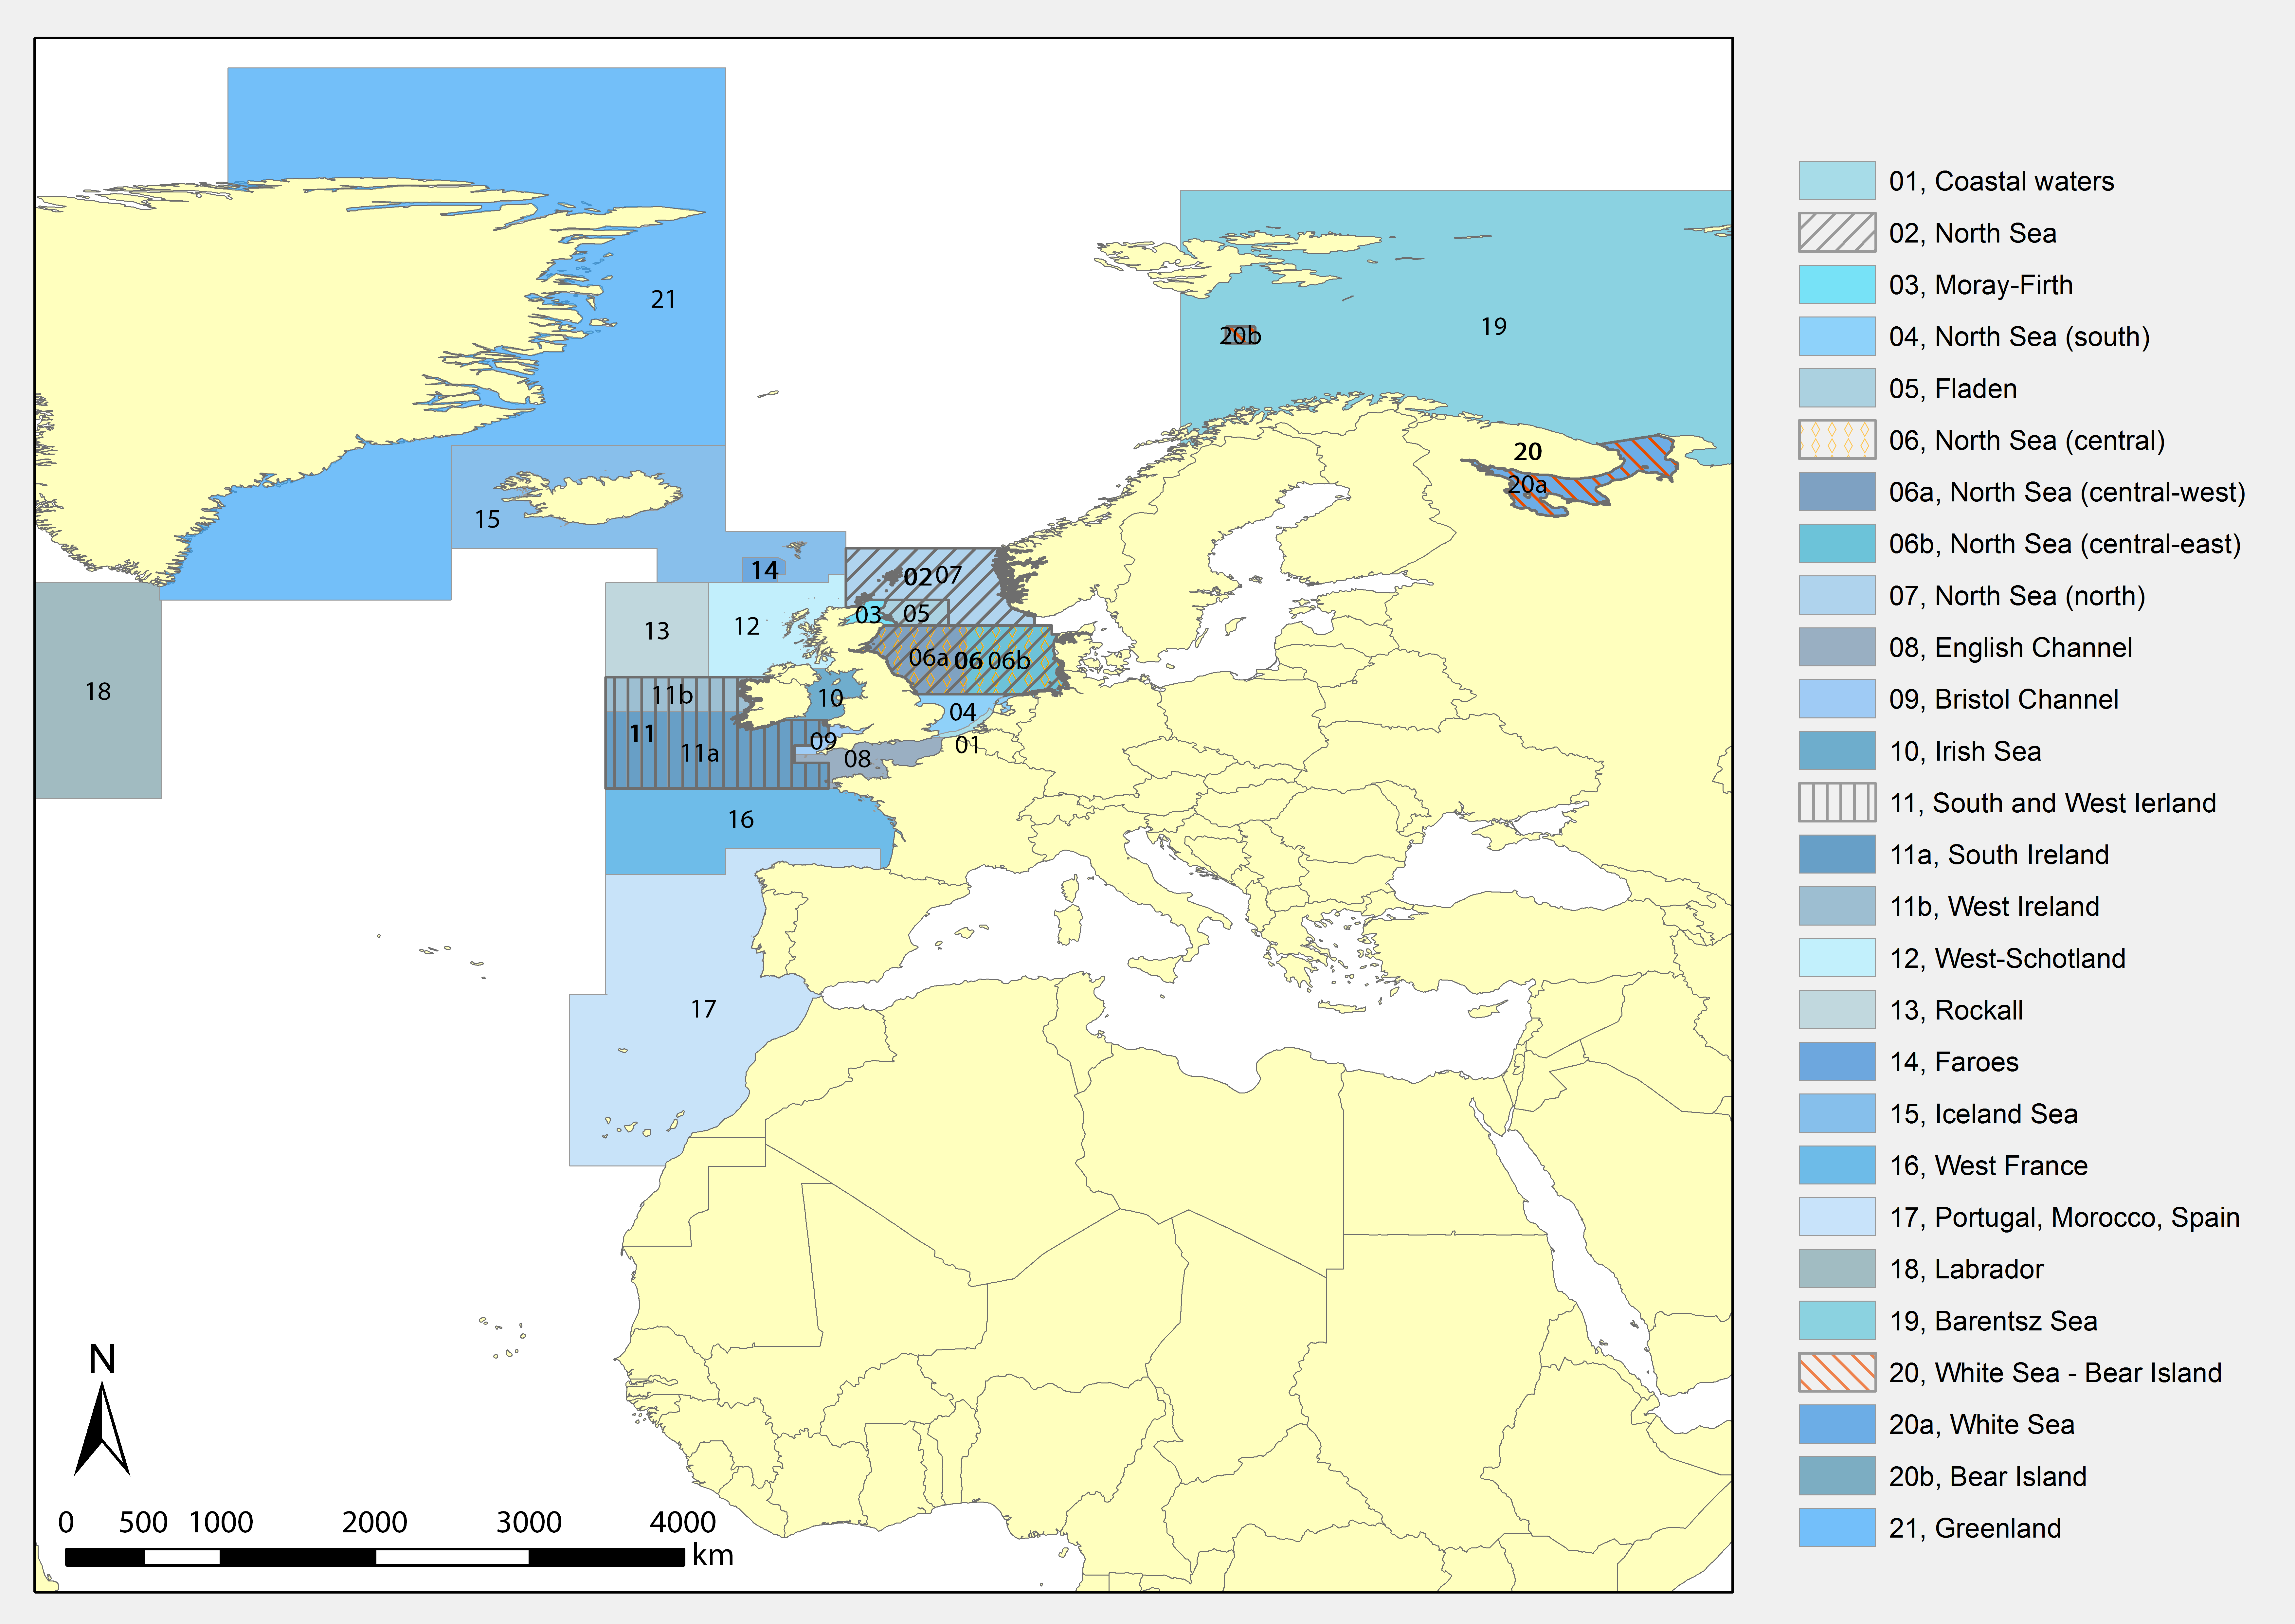
ICES Statistical Areas
The ICES Statistical Areas delineates the divisions and subdivisions of FAO Major Fishing area 27. The Areas are used as bounding areas for calculation of fish statistics, e.g. catch per unit effort (CPUE) and stock estimates.
Download ICES Statisical Areas | View Metadata
Links:
ICES Statistical Rectangles
The ICES statistical Rectangles are used as bounding areas for calculation of fish statistics, e.g. catch per unit effort (CPUE) and stock estimates.

Download ICES Statisical Rectangles | View Metadata
Links:
The NAFO Convention Area
The NAFO Convention Area encompasses a very large portion of the Atlantic Ocean and includes the 200-mile zones of Coastal States jurisdiction (USA, Canada, St. Pierre et Miquelon and Greenland). The total area under NAFO's Convention is 6,551,289 km2. Geographic delineations of the NAFO Convention Area are described in the NAFO Convention and are included in Marine Regions.
FAO Fishing Areas
The dataset represents the boundaries of the FAO Fishing Areas. The source for the boundaries is the description that can be found on the FAO website. The dataset was composed by the Flanders Marine Data and Information Centre.
Download FAO Fishing Areas Shapefile |
View Metadata
Links:
FAO Fishing Areas
(Historical) fishing areas of Belgian sea fisheries
The project 'A century of sea fisheries' brings together data and information from different, fragmented sources into an integrated database. The historical Belgian fishing grounds are included in Marine Regions.
Thematic gazetteers
Marine Natura 2000 Sources
The source of Natura 2000 sites is the GIS shapefile made available for download by the European Environment Agency. Natura 2000 sites span over the European Union (EU) territories both on land and on sea. This dataset compiles marine Natura 2000 sites. Although there isn't a defined criteria by the EU for what constitutes a Marine Natura 2000 site nor does the original dataset contain information on this matter, we defined a selection criteria to sort between marine and terrestrial sites. Thus, this dataset encompasses all sites that fall (partly) within the Exclusive Economic Zone of countries of the European Union, based on the high resolution EEZ GIS cover, V7. It might occur that a terrestrial site with marine importance, e.g. inland nesting ground for seabirds, is excluded from the selection of Marine sites or that a site with only a small marine proportion is included in this selection. This selection identifies 2,894 (partly) marine Natura 2000 sites
One of the attributes of the dataset is the site type. Site type values range from A to K and indicate whether a site belongs to:
- 1 - Natura 2000 Special Protection Area (SPA, EU Birds Directive); OR/AND
- 2 - Natura 2000 Site of Community Importance (SCI, EU Habitats Directive);
Original bilingual denominations were accounted for and correctly included in marineregions.org, however, for sites named in one single language, it was assumed that the language of appellation was the main official language of the corresponding country.
UNESCO World Heritage Marine Sites
This file contains the shapefile of the 50 marine sites inscribed on the UNESCO World Heritage List (as of 1 January 2023). Launched in 2005, the mission of the world Heritage Marine Programme is to establish effective conservation of existing and potential marine areas of Outstanding Universal Value to make sure they will be maintained and thrive for generations to come.
In order to create the data, information from the UNESCO World Heritage Marine Programme and Protected Planet were collected and compiled.
Download the World Marine Heritage Sites | View Metadata
Remarks and corrections can be sent to info@marineregions.org.
Preferred citation:
UNESCO (2023). Boundaries of UNESCO World Heritage Marine Sites (v02). Available online at https://www.marineregions.org/. https://doi.org/10.14284/592
Global contourite distribution
To create a global overview of contourite distribution, a literature study was performed. This task fits in the IGCP- and INQUA-project (http://www.vliz.be/projects/contourites). Both projects want to facilitate research and increase knowledge about these sediments deposits.
Definitions:
Contourites are sedimentary units which are deposited or substantially reworked by alongslope bottom currents. They refer to the lithological unit and the terminology reflects the grain size of the sediment. Drifts refer to the same sedimentary unit as a contourite, but the word 'drift' reflects the morphological appearance of the sedimentary unit. Their terminology reflects the external shape, and the internal shape, which is determined by seismography. If drifts are clustered into a local area of certain size, we call the clustered sediment group a Contourite Depositional System (CDS).
These sedimentary units are generally, but not exclusively, found in the deep sea (>2000m depth). They are a useful tool for determining paleoceanic and paleoclimatic changes, since their distribution is linked to bottom currents. They have gained interest from the hydrocarbon industry, since accumulation of source rocks may be influenced by bottom currents. Slope instability is also an area of interest for further research.
Source methodology:
For acquisition of the resulting information, several hundreds of papers on the relevant subject were read. When there were maps or similar images about contourites included in the paper, shapefiles were created by georeferencing them in QGIS, which were then uploaded into the Marine Regions website. If the articles did not provide such a map or image, the drifts or CDS's were marked by a single point with its set of coordinates.
In 2013, 166 records with the place type Drift were added to the Marine Gazetteer. These are linked to one of the 24 Contourite Depositional Systems, if they make part of such a system. Each drift is also influenced by a water mass or current. This water mass or current determines the sedimentation, erosion and movements of these sediments.
In 2014, the list was extended with 81 records of the place type Drift. No Contourite Depositional Systems were added. The search process was identical to 2013, only this time a summary paper was the starting point (Rebesco et al., 2014). In this publication, the major drifts were listed with their most relevant sources along with them. These listed sources were then sought after and read.
In 2018, 211 new records with the place type Drift were added to the Marine Gazetteer database, as well as 5 new records with the place type Contourite Depositional System, 14 new records with the place type Water Mass and 1 new record with the place type Current. These new features were extracted from 26 recent scientific publications (2014-2018).
All the Contourites and Contourite Depositional Systems were published as dataset in 2019.
Preferred citation:
Flanders Marine Institute; Renard Centre of Marine Geology - Ugent (2019). Global contourite distribution database, version 3. Available online at https://www.marineregions.org/. https://doi.org/10.14284/346

Regional gazetteers
Placenames Southern Bight of the North Sea and Scheldt Estuary
Different sources have been used to describe the Southern Bight of the North Sea region. The Interreg SAIL project provided geographic information on coastal regions, districts and communes bordering the Southern Bight of The North Sea. The Scheldemonitor project mapped in detail the Scheldt estuary, including the names of different mudflats and sandbanks.
Also various atlases have been used to describe in detail this area.
SCAR Composite Gazetteer of Antarctica
The SCAR Composite Gazetteer of Antarctica (CGA) has been compiled over a period of 20 years (commenced 1992) and consists of 36857 names that correspond to 18858 features. The SCAR gazetteer is available for download.
Bulgarian Antarctic Gazetteer
Bulgarian place names in Antarctica are approved by the Antarctic Place-names Commission, and formally given by the President of the Republic according to the Bulgarian Constitution and the established international practice. The Commission maintains international coordination with naming authorities of other Antarctic nations, and with the Scientific Committee on Antarctic Research (SCAR). Names given by Bulgaria are incorporated in the SCAR Composite Antarctic Gazetteer.
Four Maps representing Belgian toponyms in Antarctica
Four maps with the Belgian Toponyms of the following Antarctic regions:
- Queen Fabiola Mountains
- Sør Rondane
- Gerlache Strait
- Belgica Mountains
Australian Antarctic Gazetteer
The Australian Antarctic Names and Medal Committee (AANMC) is the authority on Australian names in the Australian Antarctic Territory, and the Territory of Heard Island and the McDonald Islands. It is responsible for the investigation and acceptance or rejection of all names proposals following prescribed procedures. These proposals must meet certain criteria in order to be accepted.
GIS meteorology of Azov and Black Seas author Vladimir Belokopytov
Included during the Ocean-Ukraine project.
New Zealand Gazetteer of place names
The New Zealand Gazetteer of Place Names contains all names for geographic places and features (both on land and undersea) within the jurisdiction of the New Zealand Geographic Board Ngā Pou Taunaha o Aotearoa (NZGB). The Board can assign, approve, alter, adopt, validate, concur with or discontinue the names of geographic and undersea features, and Crown protected areas in New Zealand, its offshore islands and continental shelf, and the Ross Dependency of Antarctica.
Canadian Geographical Names Database
The Canadian Geographical Names Data Base (CGNDB) contains nearly 350.000 approved geographical names, among which 3.500 names of undersea features. These names are authorized by the Geographical Names Board of Canada (GNBC), through its provincial, territorial and federal representatives.
The undersea features of the CGNDB were integrated in the Marine Regions gazetteer in July 2019.
Global gazetteers
GEBCO Gazetteer of undersea feature names
The undersea feature names shown on sheets and products of GEBCO and Regional International Bathymetric Charts (IBC) projects, and on international (INT) nautical charts are selected by the GEBCO Sub-Committee on Undersea Feature Names (SCUFN). This Committee, which operates under IHO and IOC, maintains and makes available a digital gazetteer of the names and geographic position of features on the sea floor.
SCUFN launched a digital gazetteer which is linked to Marine Regions, using OGC web services.
More information on GEBCO-SCUFN:
ACUF Gazetteer of undersea feature names
The Advisory Committee on Undersea Features (ACUF), maintained by the US Board on Geographic Names (BGN), works on standardization policy for names of undersea features and recommends official standard names based on proposals submitted by relevant authorities.
For more information on ACUF and to download the ACUF gazetteer visit:
ASFA thesaurus
Aquatic Sciences and Fisheries Abstracts (ASFA) is an International Cooperative Information System which comprises an abstracting and indexing service covering the world's literature on the science, technology, management, and conservation of marine, brackish water, and freshwater resources and environments, including their socio-economic and legal aspects.
Distribution records from WoRMS
The aim of a World Register of Marine Species (WoRMS) is to provide an authoritative and comprehensive list of names of marine organisms, including information on synonymy. The register contains distribution information on marine species, which is linked with Marine Regions allowing to display all species occurring is a specific biogeographic region.
Others
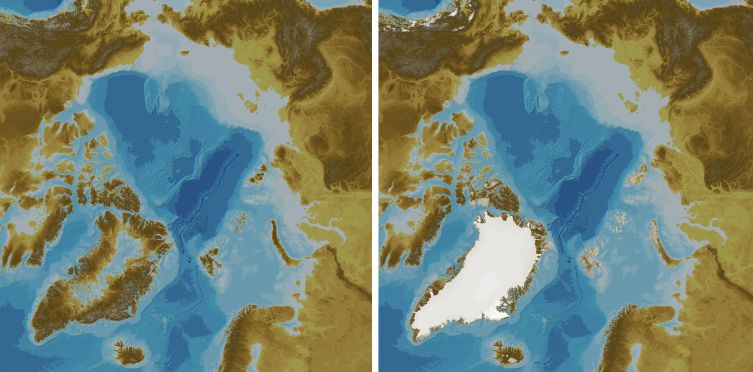
ETOPO1 Global Relief Model (Not integrated in gazetteer)
ETOPO1 is a 1 arc-minute global relief model of Earth's surface that integrates land topography and ocean bathymetry. It was built from numerous global and regional data sets, and is available in Ice Surface and Bedrock versions. Historic ETOPO2v2 and ETOPO5 global relief grids are deprecated but still available. Available Versions of the Grid (relief for the rest of the world is the same in both versions.):
- ETOPO1 Ice Surface: Grid of Earth's surface depicting the top of the Antarctic and Greenland ice sheets.
- ETOPO1 Bedrock: Grid of Earth's surface depicting the bedrock underneath the ice sheets.
More information and the grid files can be found on: http://www.ngdc.noaa.gov/
References:
- Amante, C. and B. W. Eakins, ETOPO1 1 Arc-Minute Global Relief Model: Procedures, Data Sources and Analysis. NOAA Technical Memorandum NESDIS NGDC-24, 19 pp, March 2009.
General Bathymetric Chart of the Oceans (GEBCO) (Not integrated in gazetteer)
The General Bathymetric Chart of the Oceans (GEBCO) consists of an international group of experts in ocean mapping. It operates under the joint auspices of the International Hydrographic Organization (IHO) and the Intergovernmental Oceanographic Commission (IOC) (of UNESCO). In 2017, the Nippon Foundation partnered with GEBCO to setup The Nippon Foundation-GEBCO Seabed 2030 Project with the aim of mapping the global seafloor by 2030. GEBCO makes available a range of bathymetric data sets and products. This includes global gridded bathymetric data sets and Web Map Services.

Further information about products and services can be found at: https://www.gebco.net/data_and_products/.
International Bathymetric Chart of the Southern Ocean (IBCSO) (Not integrated in gazetteer)
The International Bathymetric Chart of the Southern Ocean (IBCSO) is an international initiative dedicated to mapping the seafloor of the Southern Ocean. It provides high-resolution bathymetric data and products, serving as a critical resource for scientists, cartographers, and researchers. Supported by over 80 institutions from more than 20 countries, IBCSO compiles and improves data to address the challenges of mapping remote and often inaccessible regions.
Since 2017, IBCSO has been associated with and supported by the Nippon Foundation–GEBCO Seabed 2030 Project, extending its coverage and contributing to the global effort of mapping the seafloor by 2030. The latest version, IBCSO v2, released in June 2022, significantly expands coverage and integrates contributions to enhance its accuracy. IBCSO operates under the auspices of the International Hydrographic Organization (IHO) and the Intergovernmental Oceanographic Commission (IOC) of UNESCO, as well as being an Expert Group of the Scientific Committee on Antarctic Research (SCAR).
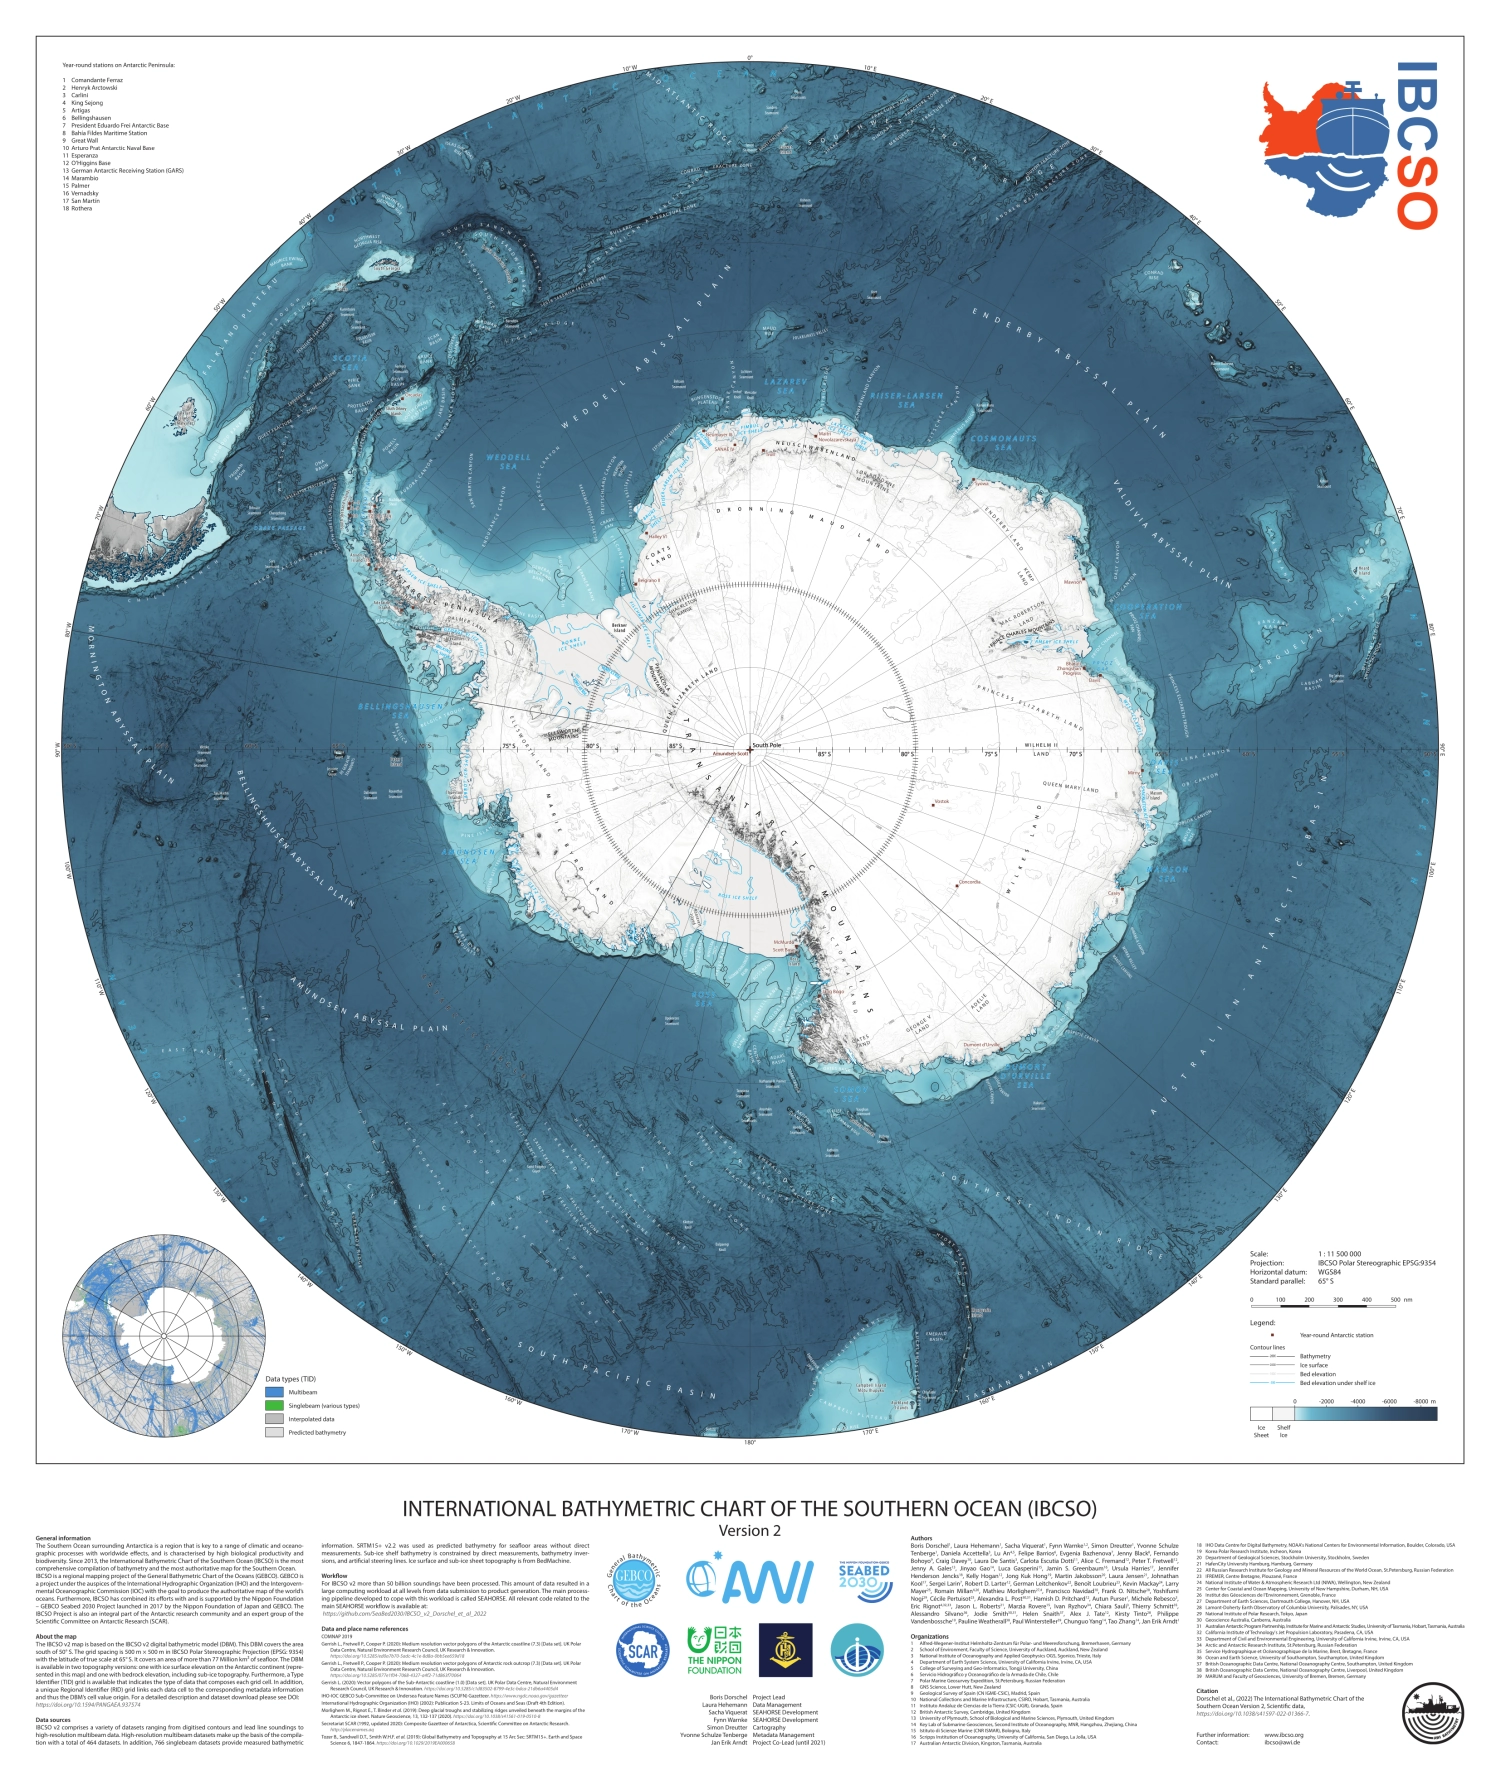
More information can be found on: https://ibcso.org/.
International Bathymetric Chart of the Arctic Ocean (IBCAO) (Not integrated in gazetteer)
The International Bathymetric Chart of the Arctic Ocean (IBCAO) is the authoritative source for bathymetry in the Arctic Ocean, providing detailed maps of the seafloor north of 64°N. Initiated in 1997, IBCAO develops digital grids based on available data, serving mapmakers, researchers, and institutions.
In 2017, IBCAO joined the Nippon Foundation–GEBCO Seabed 2030 Project, contributing to the global effort to map the entire seafloor by 2030. Its latest dataset, version 5.0, is available for download and is integrated into the global GEBCO grid. IBCAO operates under the auspices of UNESCO’s Intergovernmental Oceanographic Commission (IOC) and the International Hydrographic Organization (IHO).
More information can be found on: https://www.gebco.net/data_and_products/gridded_bathymetry_data/arctic_ocean/.
Continental margins between 140m and 3500m depth (IFREMER - COMARGE, 2009) (Not integrated in gazetteer)
This shapefile has been prepared in the framework of COMARGE, one of the field project of the Census of Marine Life. It is intended to represent continental margins worldwide, with the exclusion of the continental shelf. The continental margins have been defined based on bathymetry and expert opinion. The upper margin of the boundary has been set at 140 m depth, which is the average depth of the shelf break, except in Antarctica where the shelf break goes deeper and the upper boundary has been set up at 500 m. The lower boundary has been set at 3500 m depth. Both isobaths were extracted from S2004 Bathymetry (a global bathymetry at 1 arc-minute resolution). The upper and lower boundaries were manually edited to follow the contour of continental margins in particular cases.
Please note that some but not all margins around island are included in this shapefile. (source: Metadata)
Download Continental Margins |
View Metadata
References:
- IFREMER (Vion, A.; Menot, L.), (2009). Continental margins between 140m and 3500m depth. Available online at https://www.marineregions.org/ Consulted on 2026-07-29.
Harmful Algal Blooms (HAB) monitoring grids
Harmful Algal Blooms or HABs have a detrimental effect on the environment and can severely impact human health, marine life and ecosystems as a whole. They occur when algae grow out of control and can be caused by a number of factors, such as increased nutrient loadings or pollution. In order to monitor these events, the HAEDAT database was designed. This database contains records of HABs, based on yearly reports by ICES and PICES member states. It is part of the Harmful Algal Information system or HAIS, which is built within the International Oceanographic Data and Information Exchange (IODE) of the Intergovernmental Oceanographic Commission (IOC) of UNESCO, and in cooperation with WoRMS, ICES, PICES, IAEA and ISSHA.
The HAEDAT database also contains monitoring grids, allowing reporters to link HAB events to fixed points and polygons. Events can then be queried based on the monitoring grid they occurred in. In total, coordinates for 557 HAB monitoring grids are available, of which 554 were added to Marine Regions (TR-01, TR-04 and TR-06 were left out because of erroneous coordinates).
More information can be found on: http://haedat.iode.org/.
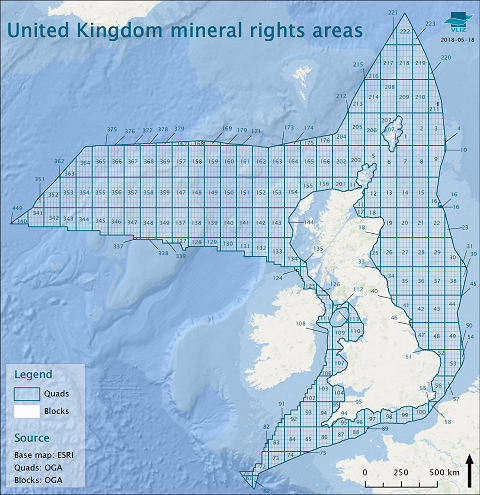
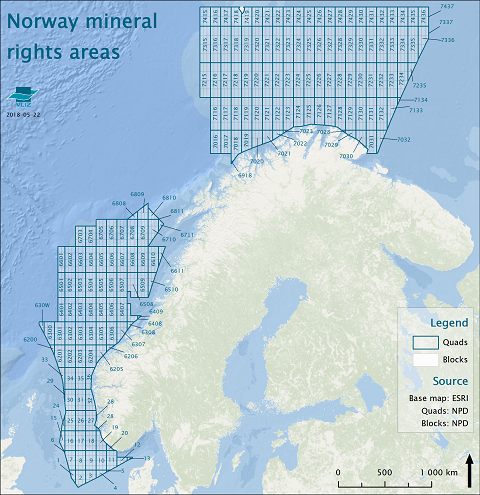
Mineral rights areas
Mineral rights areas are geographical units where exploration and exploitation of mineral resources (e.g. oil, gas) can take place. The areas are delineated by governmental agencies and (parts of) these areas can be licensed off to companies following a bidding round, allowing them to develop their activities in the area. Mineral rights areas occur both onshore and offshore. The smallest unit of division is a ‘block’. A number of blocks form a ‘quad’.
The mineral rights areas that can be found in the Marine Regions gazetteer only consist of the offshore units. The license data, which are subject to frequent alterations, are not incorporated in the data set in order to provide a sustainable link to the described features. The license data can be consulted through the awarding government’s website. The area of each block was calculated and added as a field to the attribute table.
So far, the United Kingdom and Norwegian mineral rights areas have been integrated in the gazetteer. These data have been adjusted as described above.
More information and the original shapefiles can be found on:
- United Kingdom (North Sea Transition Authority): https://www.nstauthority.co.uk/data-centre/nsta-open-data/
- Norway (Norwegian Petroleum Directorate): http://www.npd.no/
TDWG Geography shapefiles
This scheme meets the need for a standard yet adaptable system of geographical units for use in recording plant distributions and arranging specimens. Because a purely political arrangement cannot meet all the needs of botanists, the scheme's arrangement compromises between a politically and a phytogeographically oriented system. It identifies geographic units worldwide in a four-level hierarchy, incorporating continents, regions, provinces and countries. Each geographical unit at each level has its own numeric or alphanumeric code.

More information and the shapefiles can be found at the TDWG Github repository
References:
- R. K. Brummitt with assistance from F. Pando, S. Hollis, N. A. Brummitt and others. Plant Taxonomic Database Standards No. 2.ed. 2. World Geographical Scheme for Recording Plant Distributions, ed. 2. 2001. xv, 137 pp.; 17 maps. Available online at https://github.com/tdwg/wgsrpd/tree/master/109-488-1-ED/2nd%20Edition
Terrestrial Ecoregional Boundaries Shapefile (TNC) (Not integrated in gazetteer)
Global Ecoregions, Major Habitat Types, Biogeographical Realms and The Nature Conservancy Terrestrial Assessment Units as of December 14, 2009
Developed originally by Olson, D. M. and E. Dinerstein (2002), Bailey (1995) and Environment Canada (Wiken, 1986), these data layers were modified by The Nature Conservancy (TNC) to be used in its Biodiversity Planning exercises in the process known as Ecoregional Assessments. Several Ecoregions were modified from the originals by TNC staff developing the aforementioned assessments. The modifications are based on ecological, bio-physical and political rationales; most changes are noted in the accompanying documentation (attributes). Ecoregions in Canada and Mexico were modified mainly at the border with US territory, where TNC modified-Bailey (1995) ecoregions crossed over the country boundaries and the Olson, D. M. and E. Dinerstein (2002) and (Wiken, 1986) were replaced where the TNC modified-Bailey (1995) overlaid them. This layer was split from the terrestrial ecoregional assessment layer in June 2008.
Global islands database (Not integrated in gazetteer)
A 30-m spatial resolution global shoreline vector (GSV) was developed from annual composites of 2014 Landsat satellite imagery. Three size classes of islands were mapped: continental mainlands (5), islands greater than 1 km² (21,818), and islands smaller than 1 km² (318,868). The GSV represents the shore zone land and water interface boundary, and is a spatially explicit ecological domain separator between terrestrial and marine environments.

More information can be found in this paper.
The shapefile can be downloaded through this link.
Reference:
- Roger Sayre, Suzanne Noble, Sharon Hamann, Rebecca Smith, Dawn Wright, Sean Breyer, Kevin Butler, Keith Van Graafeiland, Charlie Frye, Deniz Karagulle, Dabney Hopkins, Drew Stephens, Kevin Kelly, Zeenatul Basher, Devon Burton, Jill Cress, Karina Atkins, D. Paco Van Sistine, Beverly Friesen, Rebecca Allee, Tom Allen, Peter Aniello, Irawan Asaad, Mark John Costello, Kathy Goodin, Peter Harris, Maria Kavanaugh, Helen Lillis, Eleonora Manca, Frank Muller-Karger, Bjorn Nyberg, Rost Parsons, Justin Saarinen, Jac Steiner & Adam Reed (2018): A new 30 meter resolution global shoreline vector and associated global islands database for the development of standardized ecological coastal units, Journal of Operational Oceanography, DOI: 10.1080/1755876X.2018.1529714
Emission Control Areas (Not integrated in gazetteer)
Polygon data created at Flanders Marine Institute representing the Emission Control Areas (ECAs) designated under MARPOL Annex VI. The outline coordinates were processed in June 2019. The coastline was extracted from the ESRI Countries 2014.
Available ECAs:
- Emission Control Areas (ECAs) designated under regulation 13 of MARPOL Annex VI (NOx emission control)
- Emission Control Areas (ECAs) designated under regulation 14 of MARPOL Annex VI (SOx and particulate matter emission control)
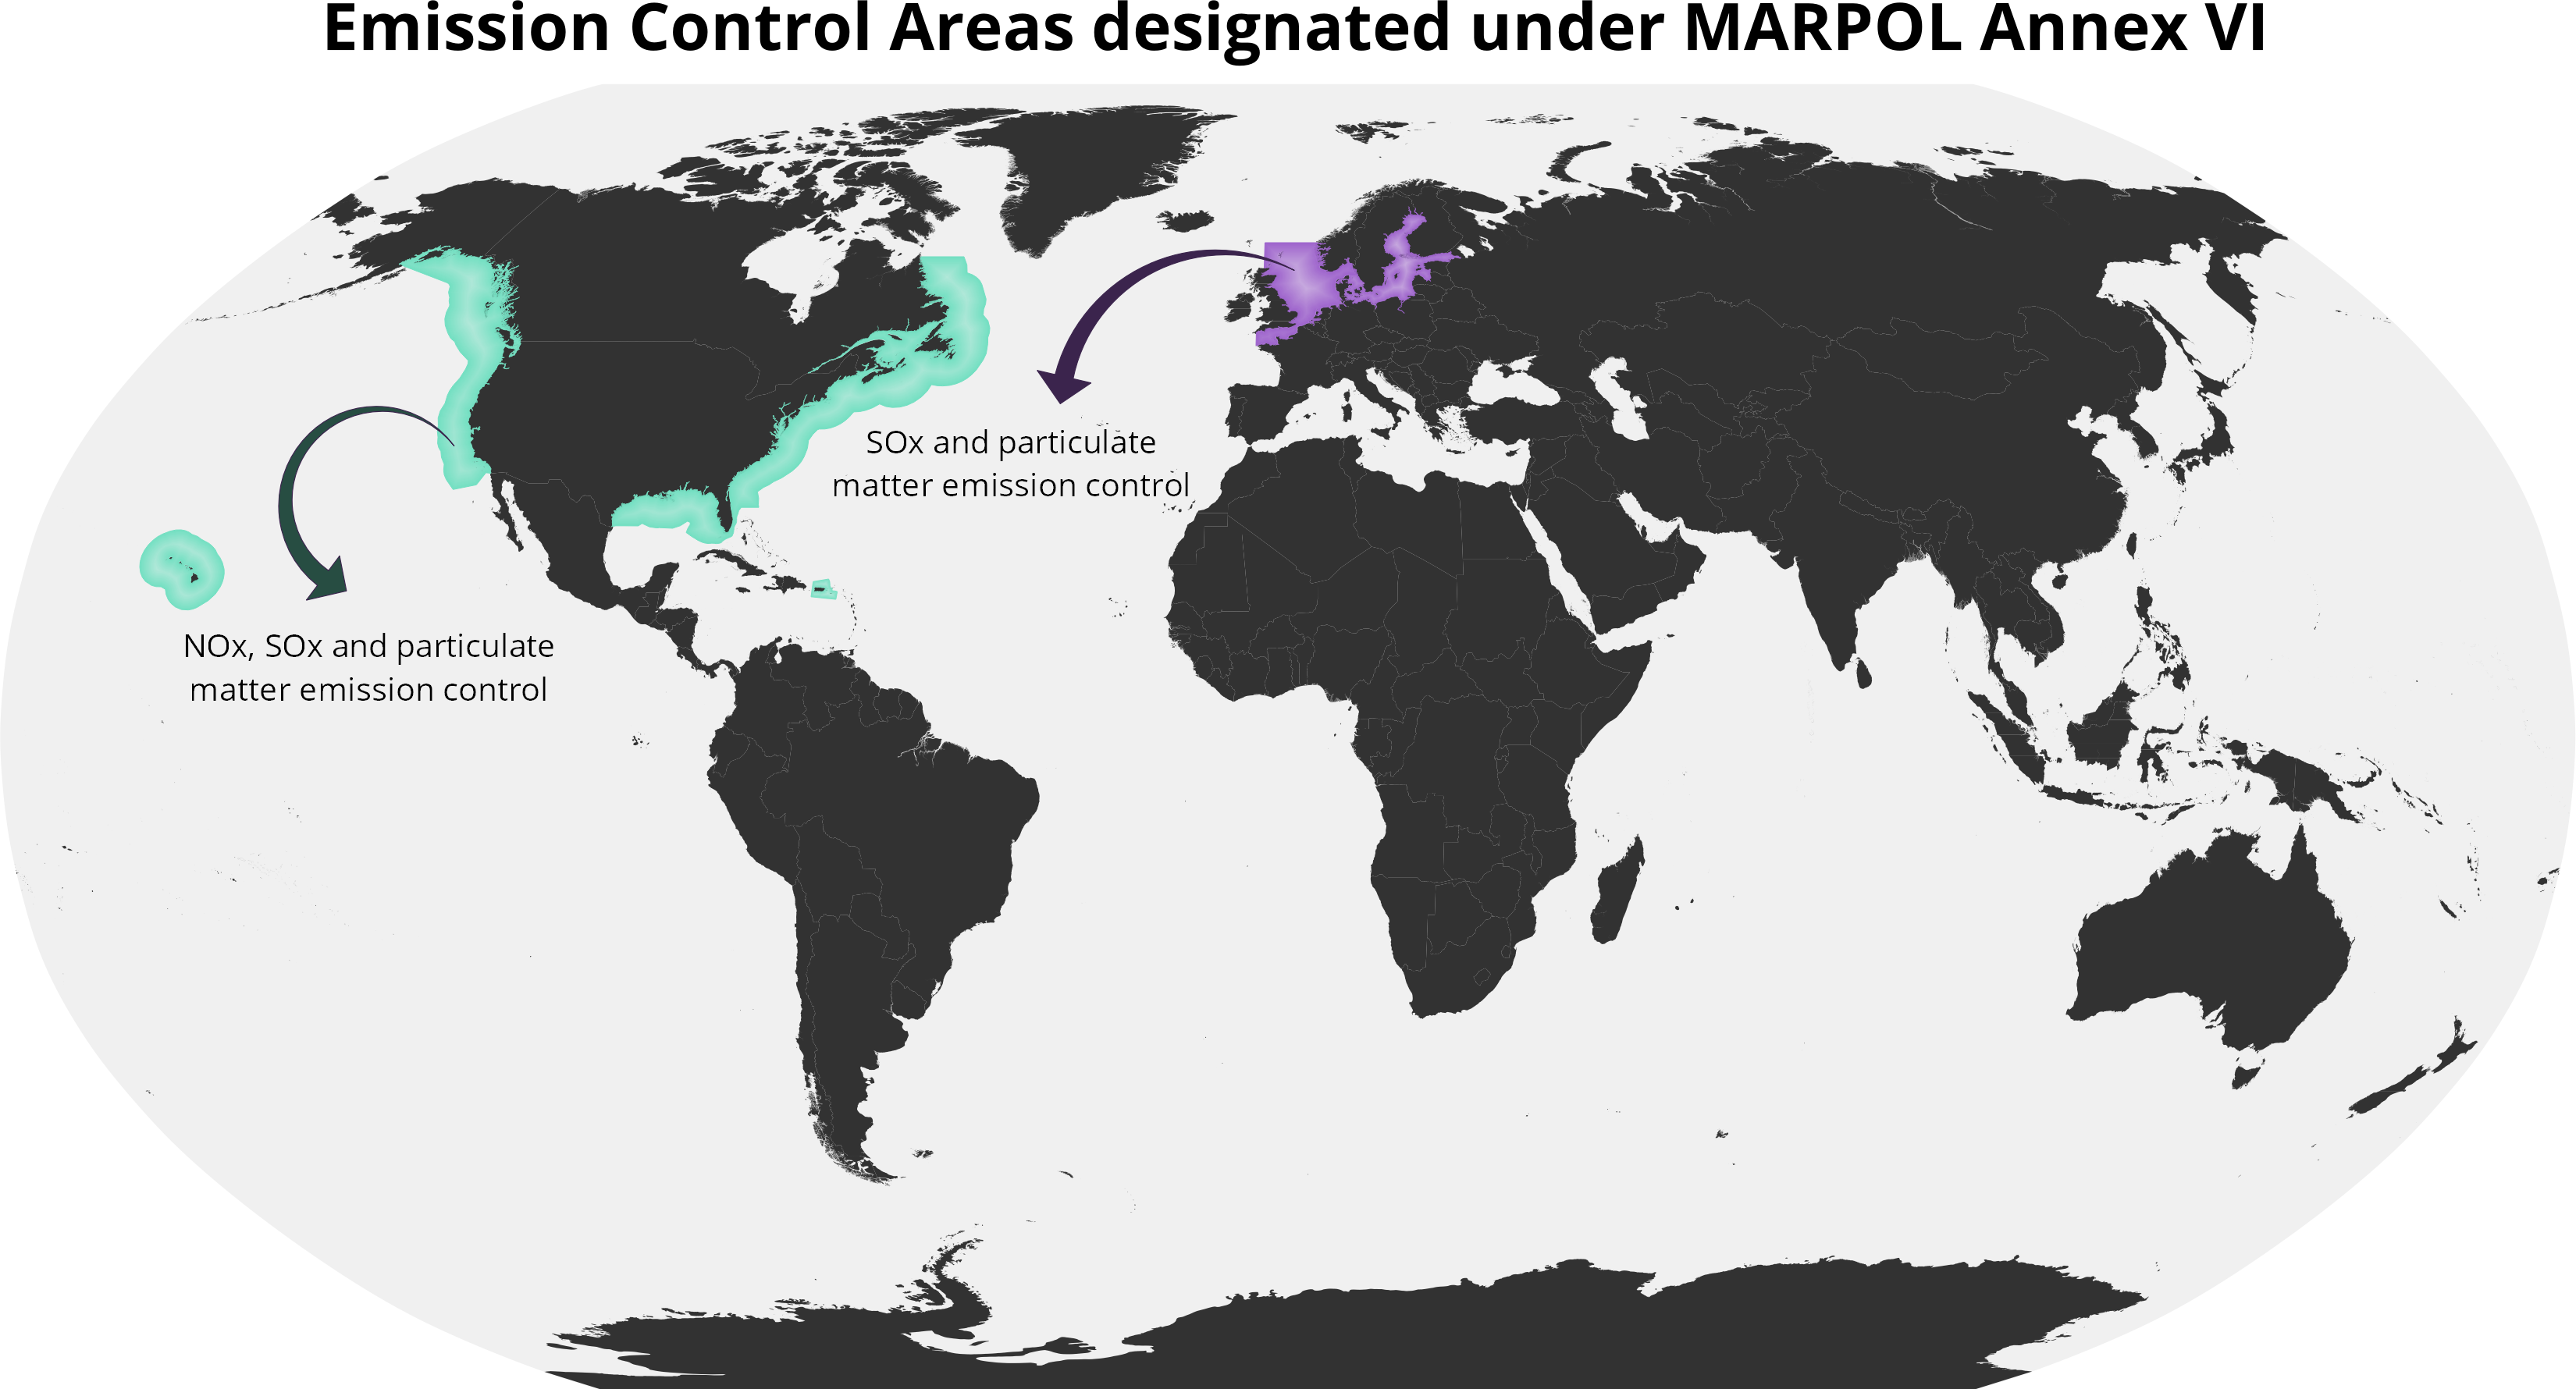
Download Emission Control Areas | View Metadata
More information can be found on the website of the International Maritime Organization.
Preferred citation:
- Flanders Marine Institute (VLIZ), Belgium; (2020). Emission Control Areas (ECAs) designated under regulation 13 of MARPOL Annex VI (NOx emission control). Available online at https://www.marineregions.org/. https://doi.org/10.14284/396
- Flanders Marine Institute (VLIZ), Belgium; (2020). Emission Control Areas (ECAs) designated under regulation 14 of MARPOL Annex VI (SOx and particulate matter emission control). Available online at https://www.marineregions.org/. https://doi.org/10.14284/397

